Indeed, the news mentions it during bear markets or market corrections as stocks slide lower. It's not a religious but a technical term describing a bearish chart stock pattern. It portends continued selling as a breakdown and subsequent downtrend ensues.
Many consider it a harbinger of a bear maker when it triggers in the benchmark indexes. At the very least, it's an indication of price weakness. In this article, we'll deeply dive into "What is a death cross?", its meaning and how to use it for your trades.
What is a Death Cross?
What is a death cross in the stock market?
The death cross is a chart pattern and technical analysis term that can apply to all financial trading instruments. It's a pattern identified on a stock trading chart with two moving average indicators. The death cross comprises a shorter-term MA and a longer-term MA. Simple moving averages can identify the pattern, but you can also consider the more exotic exponential and weighted moving averages. The bearish death cross is the opposite of a bullish golden cross pattern.
Death crosses make mainstream headlines when they form in benchmark indexes like the S&P 500 index of the Dow Jones Industrial Average. Investors who have been through bear markets have likely learned about it. Traders, notably short sellers, should be familiar with the death cross in stocks.
It's a bearish pattern that tends to indicate more selling to come. It's a breakdown signal that precedes a downtrend in prices. It's important to understand the relation to different time frames as well. Awareness of the time frame the death cross triggers is one of the most critical factors in determining whether it's a lagging or a potential foreshadowing signal.
Death Cross Explained
The death cross forms when the shorter period moving average crosses through and below the longer period moving average. When the 50-period simple moving average crosses down through the 200-period simple moving average. The period can be from intraday one-minute, five-minute, 15-minute or 60-minute to more extended time frames like daily, weekly or monthly.
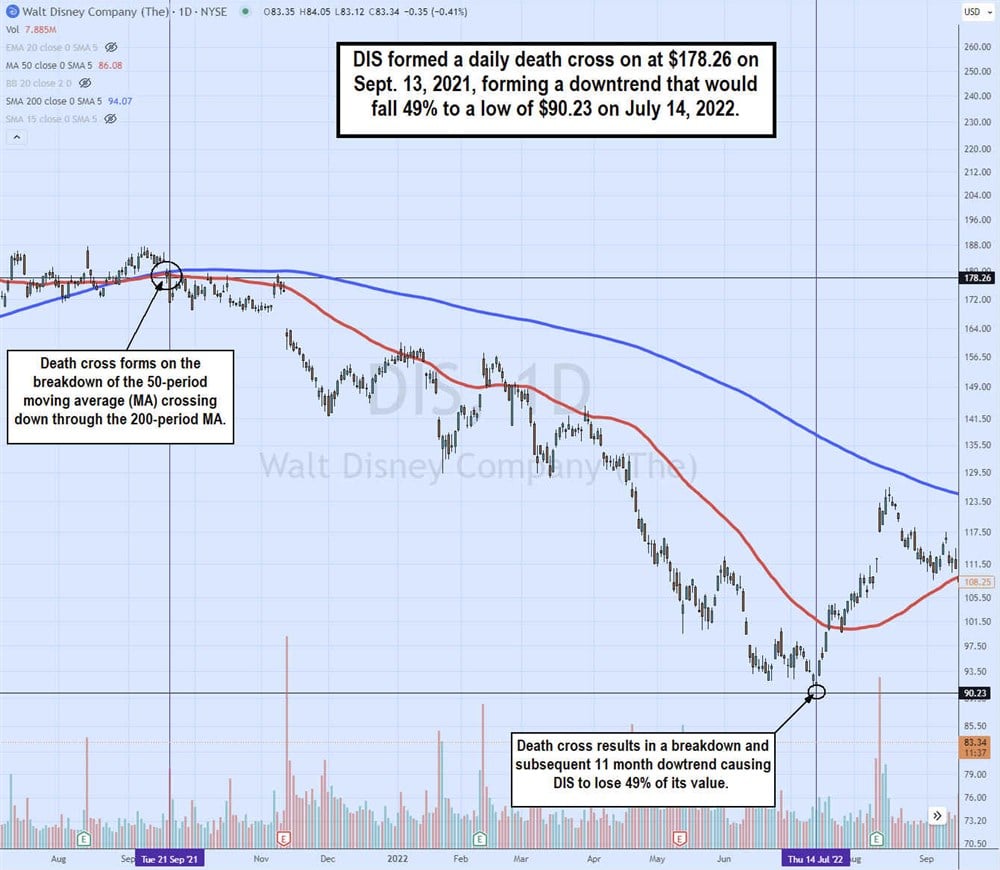
The daily death cross formed on The Walt Disney Co. (NYSE: DIS) on September 21, 2021, on the daily 50-period moving average crossover down through the daily 200-period moving average trigger.
The death cross breakdown triggered an 11-month downtrend that continued to fend off bounce attempts at the 50-period moving average, while the 200-period moving average didn't even get tested. DIS fell 40% in 11 months, reaching a low of $90.23 on July 14, 2022, before returning to $127.
Death Cross Timeframes and Periods
The death cross has been configured to use any number of different timeframes and periods. The most commonly used timeframes are the daily 50-period moving average and the daily 200-period moving average. This is the standard configuration used to identify golden crosses, so that same configuration identifies the inverse version: the death cross.
Death Cross Trading Strategy
Viewing a death cross and trading a death cross can be two different endeavors. While the textbook version of a death cross might imply trading immediately upon the 50-period moving average crossing down through the 20-period moving average, a real-life trade would wait to initiate a short position on the SPY only after it fell back below the 200-period moving average and triggers below 50-period moving average. Too often, traders take the signal literally and jump in headfirst, only to get wiggled and stopped out.
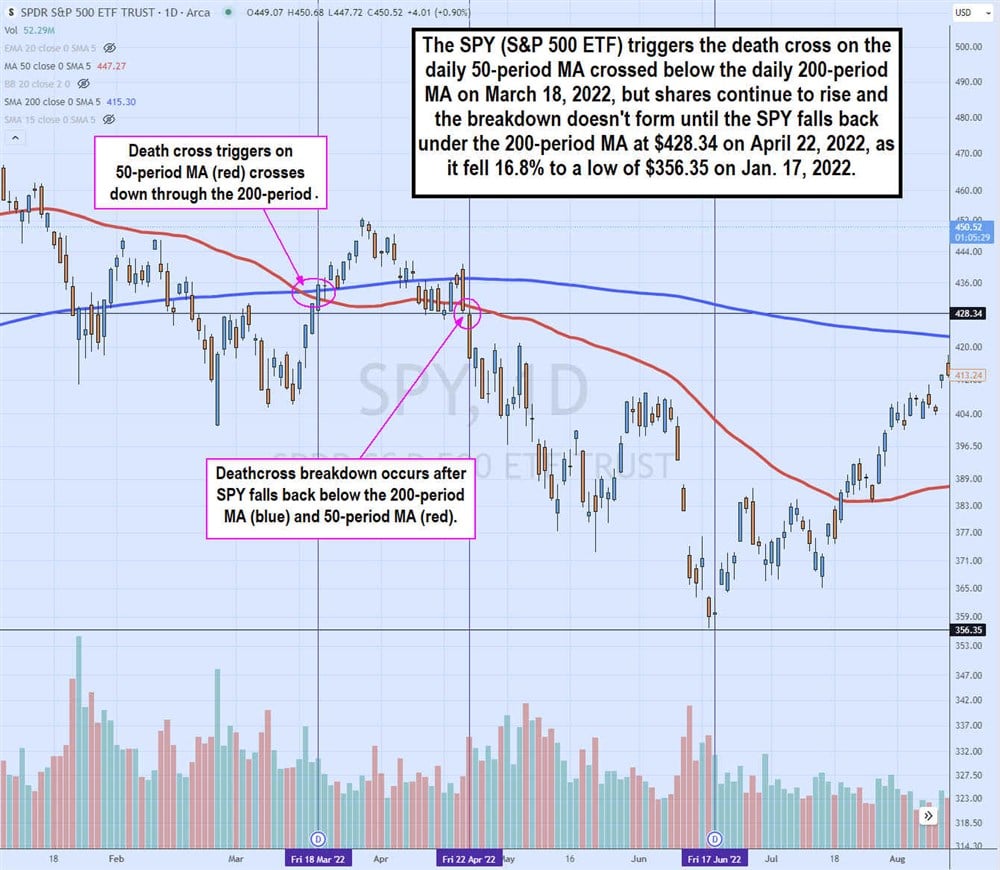
The death cross formed on the SPY when the 50-period moving average crossover through the 200-period moving average crossover on March 16, 2022. An impulsive trader might jump into the short head first at $441.73 only to have it move up to $452.69 by March 29, 2022, causing them to take a stop loss.
SPY would then fall back to $431.73 and try to hold between the daily 50-period moving average and 200-period moving average between $431 to $437. The SPY only triggers the breakdown when it falls back under the lead 50-period moving average at $428.34 on April 2, 2022. It spent the next two months falling 16.8% until reaching a low of $356.35 on June 17, 2022, before it bottoms and rallies.
You can use the death cross to trade any financial asset or class, like penny stocks, commodities, futures and even cryptocurrencies.
The strategy for a death cross is to short the stock when the 50-period moving average crosses through the 200-period moving average. But it must also fall under the 50-period moving average, indicating the downtrend is active. The death cross forms on the 50-period and 200-period moving average crossover down. However, this doesn't always result in lower prices immediately, as shown in the SPY example, as it bounced 14 points higher. The death cross triggers after shares fall under the 50-period moving average. Remember the difference between a death cross forming and triggering. The latter is the signal for potential short positions. Use the MarketBeat death cross screener to find stocks in death cross formations.
Example of a Death Cross
Let’s use the Nasdaq 100 index exchange-traded fund Invesco QQQ (NASDAQ: QQQ) as a real-life example of when it formed a death cross in 2022.
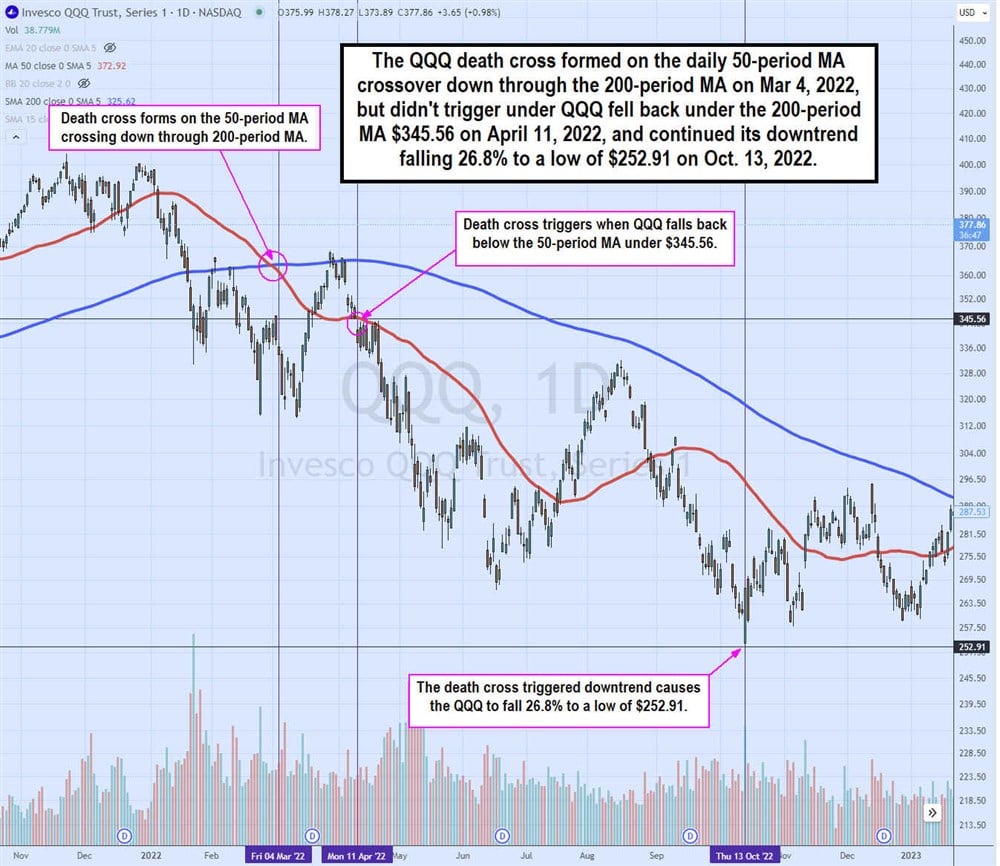
You can see the QQQ from the death cross on the 50-period moving average cross down through the 20-period moving average on March 4, 2022. The stock initially fell from $345.56 to $314.21 but then spiked to $368.49 by March 29, 2022.
This was likely a short squeeze that caused short sellers to panic to avoid larger losses. QQQ fell under the 50-period moving average at $346.01 on April 11, 2022, as it proceeded to fall 28.5% for the following seven months to reach a low of $252.91 by October 13, 2022.
During the seven months, the downtrend remained intact by holding the 200-period moving average (blue) resistance even though the 50-period moving average (red) was breached on a spike through $294.08 on July 18, 2022, rallying as high as $332.05 on August 16, 2022, but still below the 200-period moving average resistance. Shares peaked and fell toward the new lows, bottoming on October 13, 2022, at $252.91.
Death Cross vs. Golden Cross
Like two sides of the same coin, the death cross is the bearish version of the golden cross. A stock death cross is the opposite of a stock golden cross formation. A golden cross forms when the 50-period simple moving average crosses up through the 200-period moving average, triggering the breakout and uptrend. As illustrated on all charts, these two patterns can alternate back and forth since stocks don't tend to uptrend or downtrend forever.
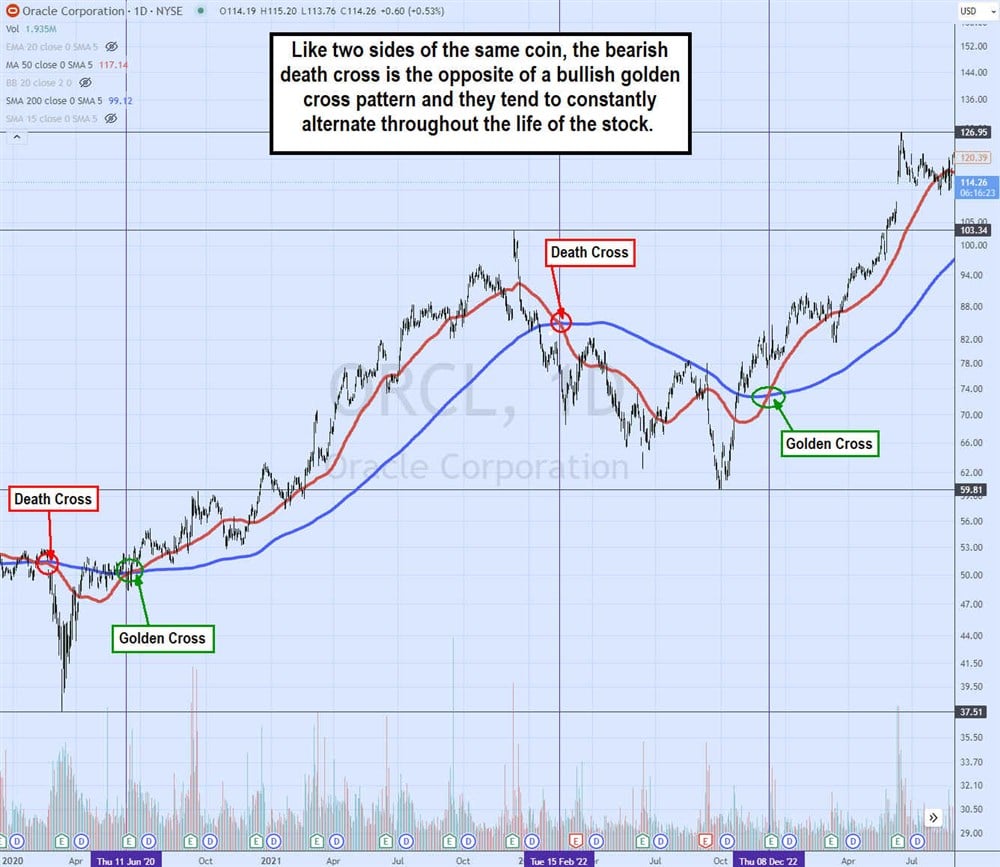
The daily candlestick chart on Oracle Co. (NASDAQ: ORCL) illustrates how the death cross and golden cross historically and constantly alternate throughout the life of the stock. The initial death cross forms on February 24, 2020, as ORCL falls to a low of $37.51 by March 11, 2022. The golden cross formed on June 11, 2020, sending shares to a high of $103.34 on December 10, 2021.
The death cross formed on February 15, 2022, as ORCL fell to a low of $59.81 on October 3, 2022. The golden cross formed on December 8, 2022, sending shares to a high of $126.95 on June 15.
Limitations of the Death Cross
The death cross is by no means a perfect technical indicator. While a good death cross can result in an extensive downtrend fueled by selling pressure, some can be short-lived. It can provide an opportunity to buy quality stock at lower prices. Fear tends to prevent investors from buying on falling stock prices, and greed tends to trigger the fear of missing out (FOMO) with investors as they chase high prices to take a position. Here are some limitations:
- Late and lagging indicator: It certainly can be a late indicator. A 50-period simple moving average needs data to form, while a 200-period moving average needs four times more data. Combining the two moving averages can result in a late or laggard signal. When the death cross forms on a daily chart, the stock will likely be in an extended downtrend on smaller period charts.
- Can produce false signals: Since the moving averages have a wide differential between the shorter and longer periods, a death cross can form after the stock has already sold off a lot and maybe put in a bottom shortly after the crossover happens. This may cause knee-jerk short sellers to step in before the stock explodes back to the upside, squeezing them out as a potential golden cross forms.
- Not a standalone indicator: Like any indicator or chart pattern, the death cross shouldn't be isolated as the only indicator or chart pattern you use to analyze the markets. The death cross is a price pattern and breakdown indicator. It helps to confirm a death cross utilizing a momentum indicator. This underscores the belief that it's not just the price that matters but how it gets to the price that paints the whole picture.
Why is the Death Cross Important?
A death cross is important for both bulls and bears. The death cross can signal a breakdown in the stock price, which can warn bulls to trim down or hedge their long positions. For bears, a death cross can signal to consider taking or adding to a short position in the stock.
The death cross using the daily 50-period simple moving average and the 200-period simple moving average has been a harbinger of market corrections and bear markets. It's been a reliable predictor of economic recessions, usually accompanied by stock bear markets. As they say, it's always the darkest before dawn. However, every death cross has eventually been completed and reversed into a golden cross in the S&P 500 index, staging bull market rallies to new all-time highs.
If you're an investor, the death cross can provide a visual tool and a warning signal to brace for an implementing breakdown and downtrend. Couple the death cross moving average pattern with an inverted yield curve for a stronger signal. It's a warning to prepare yourself for major selling pressure.
If you knew a massive tropical storm was coming to your neighborhood, wouldn't you be better prepared for it? The death cross tells you that more pain is to come. As an investor, it's up to you to either hunker down or stay the course, selling your stock or trimming your position. It also enables you to buy shares at lower prices as the stock goes on sale the longer the downtrend continues.
If you're a short seller, a death cross is often a signal to consider taking a short position. A short seller expects to make profits on falling stock prices. A short seller will borrow shares to sell at a high price first and buy them back at a lower price. A short seller closes the position when they buy to close a short position and keeps the difference between the short sold and buy cover price. The shares are returned when the position is closed.
Use a Momentum Indicator for Confirmation
When trading a death cross or even a golden cross, a momentum indicator like the relative strength index (RSI) or stochastic can fine-tune your entries and exits. The momentum indicator often confirms the buy or sell/short signals of the death cross and golden cross.
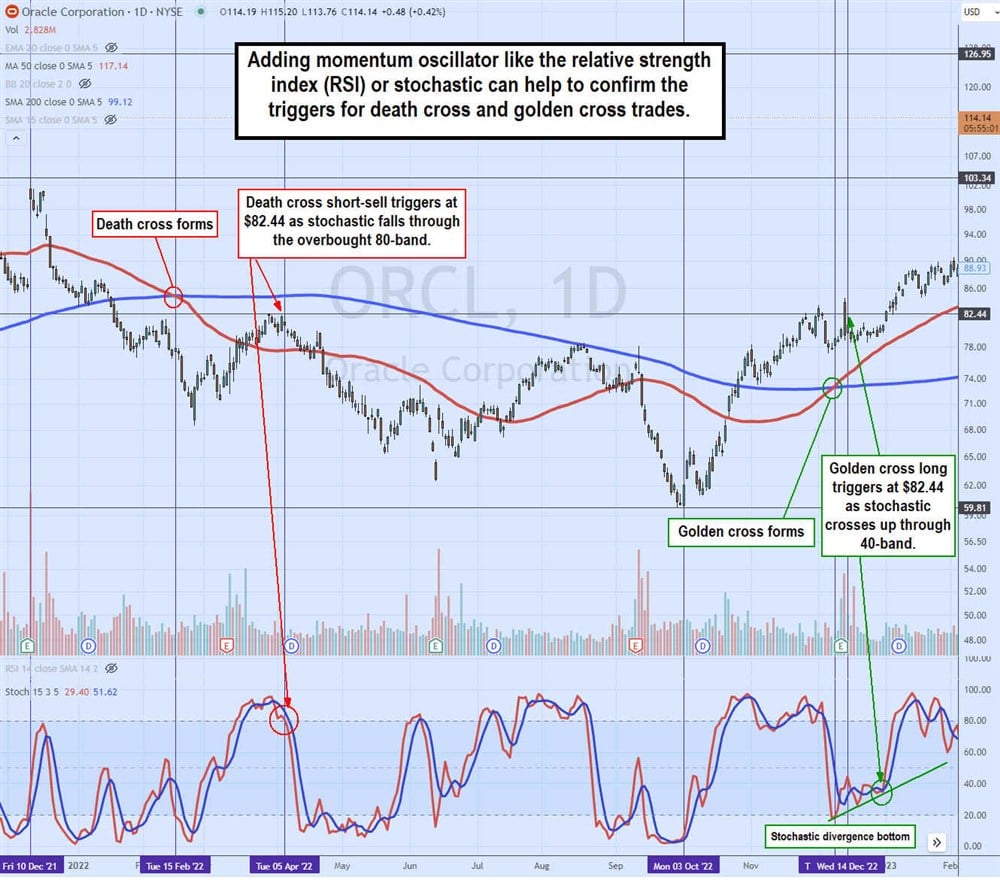
The daily ORCL candlestick chart shows the death cross form on the February 15, 2022 crossover. However, the stochastic indicates a full oscillation back up through the 80-band overbought level, sending shares back up through the 50-period moving average.
The rising stochastic illustrates this bullish momentum, which helps a trader avoid shorting into buying momentum. As ORCL falls back below the daily 50-period moving average on April 5, 2022, the stochastic triggers the short sell on the 80-band slip at $82.44. The golden cross forms on December 8, 2022, but actually triggers the long at $82.44 on December 14, 2022, when the stochastic crosses back up through the 30-band. The stochastic also forms a divergence bottom signal comprising sequentially higher stochastic cross-up levels.