WTKWY Wolters Kluwer | $153.47
+1.9% | Sale
$1,001 - $15,000 | 9/17/2023 | 8/3/2023 | +25.2%
 |
NOC Northrop Grumman | $454.92
+0.8% | Sale
$15,001 - $50,000 | 8/13/2023 | 7/19/2023 | +2.9%
 |
T AT&T | $16.84
+0.1% | Sale
$1,001 - $15,000 | 8/13/2023 | 7/14/2023 | +16.1%
 |
TEL TE Connectivity | $144.05
+0.7% | Sale
$1,001 - $15,000 | 8/13/2023 | 7/14/2023 | +2.0%
 |
F Ford Motor | $12.68
-1.2% | Sale
$1,001 - $15,000 | 8/13/2023 | 7/14/2023 | -15.4%
 |
COIN Coinbase Global | $141.99
+7.1% | Sale
$1,001 - $15,000 | 8/13/2023 | 7/14/2023 | +34.8%
 |
TSN Tyson Foods | $52.58
-2.6% | Sale
$1,001 - $15,000 | 8/13/2023 | 7/14/2023 | +0.5%
 |
ZTS Zoetis | $197.32
+0.8% | Sale
$1,001 - $15,000 | 8/13/2023 | 7/14/2023 | +14.6%
 |
THO THOR Industries | $118.42
+1.6% | Sale
$1,001 - $15,000 | 8/13/2023 | 7/14/2023 | +9.1%
 |
KO Coca-Cola | $59.56
-0.5% | Sale
$1,001 - $15,000 | 8/13/2023 | 7/14/2023 | -2.2%
 |
ABBV AbbVie | $174.08
-0.4% | Sale
$1,001 - $15,000 | 8/13/2023 | 7/14/2023 | +28.0%
 |
VTR Ventas | $45.53
+0.0% | Sale
$1,001 - $15,000 | 8/13/2023 | 7/14/2023 | -5.3%
 |
DAR Darling Ingredients | $41.58
+1.1% | Sale
$1,001 - $15,000 | 8/13/2023 | 7/14/2023 | -34.8%
 |
MRK Merck & Co., Inc. | $125.45
-0.9% | Sale
$1,001 - $15,000 | 8/13/2023 | 7/14/2023 | +16.9%
 |
JNJ Johnson & Johnson | $156.76
+0.2% | Sale
$1,001 - $15,000 | 8/13/2023 | 7/14/2023 | -1.9%
 |
PLD Prologis | $132.48
+0.6% | Sale
$1,001 - $15,000 | 8/13/2023 | 7/14/2023 | +3.7%
 |
MO Altria Group | $40.11
+0.0% | Sale
$1,001 - $15,000 | 8/13/2023 | 7/14/2023 | -11.8%
 |
TMUS T-Mobile US | $162.19
+0.8% | Sale
$1,001 - $15,000 | 8/13/2023 | 7/14/2023 | +16.1%
 |
APTV Aptiv | $82.02
+0.9% | Sale
$1,001 - $15,000 | 8/13/2023 | 7/14/2023 | -26.1%
 |
PFE Pfizer | $27.56
0.0% | Sale
$15,001 - $50,000 | 8/13/2023 | 7/12/2023 | -23.4%
 |
CAG Conagra Brands | $27.40
-2.5% | Sale
$1,001 - $15,000 | 8/13/2023 | 7/12/2023 | -16.9%
 |
UPS United Parcel Service | $146.26
-1.1% | Sale
$1,001 - $15,000 | 8/13/2023 | 7/12/2023 | -21.6%
 |
PSA Public Storage | $284.07
-0.3% | Sale
$50,001 - $100,000 | 8/13/2023 | 7/12/2023 | -4.1%
 |
SBGI Sinclair | $14.54
+3.7% | Sale
$1,001 - $15,000 | 8/13/2023 | 7/12/2023 | +7.3%
 |
SR Spire | $58.35
-0.2% | Sale
$1,001 - $15,000 | 8/13/2023 | 7/12/2023 | -8.6%
 |
HST Host Hotels & Resorts | $19.58
+0.2% | Sale
$15,001 - $50,000 | 8/13/2023 | 7/12/2023 | +11.1%
 |
PLD Prologis | $132.48
+0.6% | Sale
$100,001 - $250,000 | 8/13/2023 | 7/12/2023 | +5.8%
 |
YUMC Yum China | $40.31
+1.7% | Sale
$15,001 - $50,000 | 8/13/2023 | 7/12/2023 | -31.9%
 |
SKT Tanger | $26.96
+1.7% | Sale
$15,001 - $50,000 | 8/13/2023 | 7/12/2023 | +16.4%
 |
UDR UDR | $35.37
-0.3% | Sale
$1,001 - $15,000 | 8/13/2023 | 7/12/2023 | -18.1%
 |
FNF Fidelity National Financial | $51.22
+0.7% | Sale
$15,001 - $50,000 | 8/13/2023 | 7/12/2023 | +38.0%
 |
FCPT Four Corners Property Trust | $23.10
+0.7% | Sale
$1,001 - $15,000 | 8/13/2023 | 7/12/2023 | -11.3%
 |
ES Eversource Energy | $54.98
+1.7% | Sale
$1,001 - $15,000 | 8/13/2023 | 7/12/2023 | -24.1%
 |
EXR Extra Space Storage | $143.38
-0.1% | Sale
$15,001 - $50,000 | 8/13/2023 | 7/12/2023 | -5.6%
 |
RWT Redwood Trust | $6.60
+1.7% | Sale
$1,001 - $15,000 | 8/13/2023 | 7/12/2023 | +3.0%
 |
USB U.S. Bancorp | $40.18
-0.5% | Sale
$15,001 - $50,000 | 8/13/2023 | 7/12/2023 | +14.4%
 |
CCI Crown Castle | $108.40
+0.8% | Sale
$50,001 - $100,000 | 8/13/2023 | 7/12/2023 | -6.9%
 |
PEAK Healthpeak Properties | $17.34
-3.6% | Sale
$1,001 - $15,000 | 8/13/2023 | 7/12/2023 | -17.3%
 |
EPRT Essential Properties Realty Trust | $24.59
-0.2% | Sale
$15,001 - $50,000 | 8/13/2023 | 7/12/2023 | +1.9%
 |
UE Urban Edge Properties | $17.54
-0.2% | Sale
$1,001 - $15,000 | 8/13/2023 | 7/12/2023 | +5.9%
 |
FIS Fidelity National Information Services | $61.76
+0.5% | Sale
$15,001 - $50,000 | 8/13/2023 | 7/12/2023 | +4.3%
 |
INN Summit Hotel Properties | $6.64
+0.8% | Sale
$1,001 - $15,000 | 8/13/2023 | 7/12/2023 | +0.9%
 |
EQIX Equinix | $855.76
+0.1% | Sale
$50,001 - $100,000 | 8/13/2023 | 7/12/2023 | +8.2%
 |
EVBG Everbridge | $28.18
+0.1% | Sale
$1,001 - $15,000 | 8/13/2023 | 7/12/2023 | -6.7%
 |
EIX Edison International | $64.70
0.0% | Sale
$1,001 - $15,000 | 8/13/2023 | 7/12/2023 | -8.2%
 |
CBU Community Bank System | $44.88
+1.9% | Sale
$15,001 - $50,000 | 8/13/2023 | 7/12/2023 | +0.7%
 |
DRH DiamondRock Hospitality | $9.23
-0.4% | Sale
$1,001 - $15,000 | 8/13/2023 | 7/12/2023 | +12.4%
 |
RTX RTX | $90.51
-0.6% | Sale
$50,001 - $100,000 | 8/13/2023 | 7/12/2023 | -6.5%
 |
SYY Sysco | $79.55
+0.3% | Sale
$1,001 - $15,000 | 8/13/2023 | 7/12/2023 | +7.7%
 |
CUBE CubeSmart | $43.96
-0.2% | Sale
$1,001 - $15,000 | 8/13/2023 | 7/12/2023 | -4.0%
 |
PHIN PHINIA | $30.09
+0.2% | Sale
$1,001 - $15,000 | 8/13/2023 | 7/12/2023 | |
WPM Wheaton Precious Metals | $45.49
-0.9% | Sale
$50,001 - $100,000 | 8/13/2023 | 7/12/2023 | +3.2%
 |
PYPL PayPal | $58.91
+5.0% | Sale
$1,001 - $15,000 | 8/13/2023 | 7/12/2023 | -16.5%
 |
DLTR Dollar Tree | $139.50
-1.0% | Sale
$15,001 - $50,000 | 8/13/2023 | 7/12/2023 | -5.5%
 |
HALO Halozyme Therapeutics | $35.49
+0.7% | Sale
$15,001 - $50,000 | 8/13/2023 | 7/12/2023 | -4.6%
 |
UNH UnitedHealth Group | $518.22
-0.4% | Sale
$15,001 - $50,000 | 8/13/2023 | 7/12/2023 | +14.7%
 |
ICHR Ichor | $42.90
+4.1% | Sale
$1,001 - $15,000 | 8/13/2023 | 7/12/2023 | +25.9%
 |
UBA Urstadt Biddle Properties | $21.14
-1.8% | Sale
$15,001 - $50,000 | 8/13/2023 | 7/12/2023 | -3.0%
 |
SHO Sunstone Hotel Investors | $10.75
+0.1% | Sale
$1,001 - $15,000 | 8/13/2023 | 7/12/2023 | +4.3%
 |
KHC Kraft Heinz | $35.97
-1.4% | Sale
$1,001 - $15,000 | 8/13/2023 | 7/12/2023 | +0.6%
 |
WELL Welltower | $87.66
+0.8% | Sale
$15,001 - $50,000 | 8/13/2023 | 7/12/2023 | +10.0%
 |
IOT Samsara | $35.47
+3.4% | Sale
$1,001 - $15,000 | 8/13/2023 | 7/12/2023 | +29.3%
 |
TMUS T-Mobile US | $162.19
+0.8% | Sale
$15,001 - $50,000 | 8/13/2023 | 7/12/2023 | +15.1%
 |
GILD Gilead Sciences | $73.67
-0.2% | Sale
$15,001 - $50,000 | 8/13/2023 | 7/12/2023 | -3.5%
 |
GTY Getty Realty | $27.15
-0.4% | Sale
$1,001 - $15,000 | 8/13/2023 | 7/12/2023 | -19.2%
 |
SLG SL Green Realty | $44.51
-0.5% | Sale
$15,001 - $50,000 | 8/13/2023 | 7/12/2023 | +40.1%
 |
PECO Phillips Edison & Company, Inc. | $34.97
+0.5% | Sale
$15,001 - $50,000 | 8/13/2023 | 7/12/2023 | +2.6%
 |
PGR Progressive | $182.72
-0.1% | Sale
$50,001 - $100,000 | 8/13/2023 | 7/12/2023 | +38.3%
 |
DG Dollar General | $135.21
-0.3% | Sale
$50,001 - $100,000 | 8/13/2023 | 7/12/2023 | -19.8%
 |
SBAC SBA Communications | $217.45
+0.6% | Sale
$15,001 - $50,000 | 8/13/2023 | 7/12/2023 | -10.6%
 |
BFS Saul Centers | $37.95
0.0% | Sale
$1,001 - $15,000 | 8/13/2023 | 7/12/2023 | -2.5%
 |
QDEL QuidelOrtho | $68.15
+1.7% | Sale
$1,001 - $15,000 | 8/13/2023 | 7/12/2023 | -21.9%
 |
TNDM Tandem Diabetes Care | $23.30
+0.6% | Sale
$1,001 - $15,000 | 8/13/2023 | 7/12/2023 | -20.9%
 |
TFX Teleflex | $252.04
+0.3% | Sale
$15,001 - $50,000 | 8/13/2023 | 7/12/2023 | +2.2%
 |
ENTA Enanta Pharmaceuticals | $12.34
-0.2% | Sale
$1,001 - $15,000 | 8/13/2023 | 7/12/2023 | -36.9%
 |
HHC Howard Hughes | $78.08
+0.7% | Sale
$1,001 - $15,000 | 8/13/2023 | 7/12/2023 | -4.4%
 |
URI United Rentals | $650.35
+0.5% | Sale
$1,001 - $15,000 | 8/13/2023 | 7/12/2023 | +39.2%
 |
TRIP Tripadvisor | $21.71
-3.7% | Sale
$1,001 - $15,000 | 8/13/2023 | 7/12/2023 | +24.1%
 |
ROIC Retail Opportunity Investments | $13.44
-2.3% | Sale
$15,001 - $50,000 | 8/13/2023 | 7/12/2023 | -3.4%
 |
D Dominion Energy | $44.70
+1.2% | Sale
$50,001 - $100,000 | 8/13/2023 | 7/12/2023 | -15.2%
 |
HEI.A HEICO | $148.54
+0.7% | Sale
$1,001 - $15,000 | 8/13/2023 | 7/12/2023 | +6.7%
 |
FERG Ferguson | $198.66
+0.5% | Sale
$1,001 - $15,000 | 8/13/2023 | 7/12/2023 | +23.6%
 |
EXC Exelon | $33.84
+0.3% | Sale
$15,001 - $50,000 | 8/13/2023 | 7/12/2023 | -19.5%
 |
RLAY Relay Therapeutics | $9.09
+2.2% | Sale
$1,001 - $15,000 | 8/13/2023 | 7/12/2023 | -29.9%
 |
TFC Truist Financial | $35.84
+0.9% | Sale
$15,001 - $50,000 | 8/13/2023 | 7/12/2023 | +8.5%
 |
EPR EPR Properties | $42.40
-0.4% | Sale
$1,001 - $15,000 | 8/13/2023 | 7/12/2023 | -8.6%
 |
RLJ RLJ Lodging Trust | $11.68
+0.3% | Sale
$1,001 - $15,000 | 8/13/2023 | 7/12/2023 | +11.5%
 |
KO Coca-Cola | $59.56
-0.5% | Sale
$15,001 - $50,000 | 8/13/2023 | 7/12/2023 | -0.5%
 |
SGH SMART Global | $22.85
+3.9% | Sale
$1,001 - $15,000 | 8/13/2023 | 7/12/2023 | -15.7%
 |
FN Fabrinet | $204.56
+4.3% | Sale
$15,001 - $50,000 | 8/13/2023 | 7/12/2023 | +54.7%
 |
PLTK Playtika | $7.35
+0.7% | Sale
$1,001 - $15,000 | 8/13/2023 | 7/12/2023 | -42.2%
 |
VZ Verizon Communications | $39.72
-0.5% | Sale
$100,001 - $250,000 | 8/13/2023 | 7/12/2023 | +13.9%
 |
STT State Street | $72.84
+0.6% | Sale
$15,001 - $50,000 | 8/13/2023 | 7/12/2023 | -4.0%
 |
ESS Essex Property Trust | $229.80
+0.2% | Sale
$15,001 - $50,000 | 8/13/2023 | 7/12/2023 | -4.5%
 |
EPAM EPAM Systems | $286.27
-0.3% | Sale
$15,001 - $50,000 | 8/13/2023 | 7/12/2023 | +22.7%
 |
TMO Thermo Fisher Scientific | $550.75
0.0% | Sale
$50,001 - $100,000 | 8/13/2023 | 7/12/2023 | +4.7%
 |
RBA RB Global | $68.64
+1.0% | Sale
$1,001 - $15,000 | 8/13/2023 | 7/12/2023 | +13.8%
 |
EQR Equity Residential | $58.86
-0.6% | Sale
$50,001 - $100,000 | 8/13/2023 | 7/12/2023 | -12.7%
 |
PEB Pebblebrook Hotel Trust | $15.74
+1.0% | Sale
$1,001 - $15,000 | 8/13/2023 | 7/12/2023 | +11.1%
 |
STX Seagate Technology | $89.41
+2.0% | Sale
$1,001 - $15,000 | 8/13/2023 | 7/12/2023 | +45.1%
 |
LBTYA Liberty Global | $19.09
+0.2% | Sale
$1,001 - $15,000 | 8/13/2023 | 7/12/2023 | +5.9%
 |
T AT&T | $16.84
+0.1% | Sale
$50,001 - $100,000 | 8/13/2023 | 7/12/2023 | +11.3%
 |
ALEX Alexander & Baldwin | $17.17
-0.2% | Sale
$1,001 - $15,000 | 8/13/2023 | 7/12/2023 | -10.6%
 |
AYX Alteryx | $47.73
+0.1% | Sale
$1,001 - $15,000 | 8/13/2023 | 7/12/2023 | +10.3%
 |
AMT American Tower | $194.44
+0.4% | Sale
$50,001 - $100,000 | 8/13/2023 | 7/12/2023 | -0.5%
 |
IRM Iron Mountain | $68.63
+0.1% | Sale
$1,001 - $15,000 | 8/13/2023 | 7/12/2023 | +15.6%
 |
LSI Life Storage | $133.10
-0.8% | Sale
$1,001 - $15,000 | 8/13/2023 | 7/12/2023 | -1.9%
 |
BXP Boston Properties | $64.18
-1.4% | Sale
$50,001 - $100,000 | 8/13/2023 | 7/12/2023 | +5.2%
 |
JBGS JBG SMITH Properties | $16.92
+0.4% | Sale
$1,001 - $15,000 | 8/13/2023 | 7/12/2023 | +5.8%
 |
MMM 3M | $92.90
-0.3% | Sale
$15,001 - $50,000 | 8/13/2023 | 7/12/2023 | -8.6%
 |
NVO Novo Nordisk A/S | $121.20
+2.4% | Sale
$100,001 - $250,000 | 8/13/2023 | 7/12/2023 | +213.2%
 |
ANET Arista Networks | $282.45
+2.4% | Sale
$1,001 - $15,000 | 8/13/2023 | 7/12/2023 | +72.2%
 |
ADC Agree Realty | $57.53
-0.8% | Sale
$1,001 - $15,000 | 8/13/2023 | 7/12/2023 | -12.2%
 |
KDP Keurig Dr Pepper | $31.15
-1.1% | Sale
$15,001 - $50,000 | 8/13/2023 | 7/12/2023 | -0.4%
 |
ARE Alexandria Real Estate Equities | $116.20
-1.4% | Sale
$15,001 - $50,000 | 8/13/2023 | 7/12/2023 | -1.3%
 |
JAZZ Jazz Pharmaceuticals | $123.43
+0.6% | Sale
$15,001 - $50,000 | 8/13/2023 | 7/12/2023 | -1.5%
 |
OGS ONE Gas | $60.85
+1.0% | Sale
$1,001 - $15,000 | 8/13/2023 | 7/12/2023 | -21.8%
 |
LVMUY LVMH Moët Hennessy - Louis Vuitton, Société Européenne | $175.00
+1.2% | Sale
$100,001 - $250,000 | 8/13/2023 | 7/12/2023 | -9.3%
 |
BEPC Brookfield Renewable | $25.50
+0.4% | Sale
$1,001 - $15,000 | 8/13/2023 | 7/12/2023 | -20.0%
 |
LHX L3Harris Technologies | $209.84
+0.3% | Sale
$50,001 - $100,000 | 8/13/2023 | 7/12/2023 | +7.1%
 |
SCHW Charles Schwab | $63.37
+1.4% | Sale
$15,001 - $50,000 | 8/13/2023 | 7/12/2023 | +8.4%
 |
IFF International Flavors & Fragrances | $79.94
-0.7% | Sale
$1,001 - $15,000 | 8/13/2023 | 7/12/2023 | -2.1%
 |
NXRT NexPoint Residential Trust | $30.68
-0.1% | Sale
$1,001 - $15,000 | 8/13/2023 | 7/12/2023 | -37.3%
 |
CHPT ChargePoint | $2.15
+2.4% | Sale
$15,001 - $50,000 | 8/13/2023 | 7/12/2023 | -76.1%
 |
LBTYK Liberty Global | $20.23
+0.4% | Sale
$1,001 - $15,000 | 8/13/2023 | 7/12/2023 | +6.4%
 |
AVTR Avantor | $23.21
-0.4% | Sale
$1,001 - $15,000 | 8/13/2023 | 7/12/2023 | +11.5%
 |
PARAA Paramount Global | 20.75
+1.1% | Sale
$1,001 - $15,000 | 8/13/2023 | 7/12/2023 | +9.6%
 |
CLVT Clarivate | $9.42
+1.3% | Sale
$1,001 - $15,000 | 8/13/2023 | 7/12/2023 | -4.4%
 |
ADM Archer-Daniels-Midland | $53.05
+0.7% | Sale
$50,001 - $100,000 | 8/13/2023 | 7/12/2023 | -32.6%
 |
MOS Mosaic | $29.92
-0.6% | Sale
$1,001 - $15,000 | 8/13/2023 | 7/12/2023 | -16.6%
 |
MELI MercadoLibre | $1,742.26
+0.5% | Sale
$50,001 - $100,000 | 8/13/2023 | 7/12/2023 | +52.7%
 |
AVB AvalonBay Communities | $174.63
+0.1% | Sale
$50,001 - $100,000 | 8/13/2023 | 7/12/2023 | -10.1%
 |
AMCX AMC Networks | $14.41
-15.4% | Sale
$1,001 - $15,000 | 8/13/2023 | 7/12/2023 | +11.5%
 |
LMT Lockheed Martin | $426.50
-0.1% | Sale
$15,001 - $50,000 | 8/13/2023 | 7/12/2023 | -7.7%
 |
MRNA Moderna | $87.41
-6.7% | Sale
$50,001 - $100,000 | 8/13/2023 | 7/12/2023 | -30.6%
 |
CADE Cadence Bank | $26.75
+3.7% | Sale
$1,001 - $15,000 | 8/13/2023 | 7/12/2023 | +27.9%
 |
BELFB Bel Fuse | $72.08
+3.2% | Sale
$1,001 - $15,000 | 8/13/2023 | 7/12/2023 | +29.6%
 |
PODD Insulet | $192.55
-2.1% | Sale
$1,001 - $15,000 | 8/13/2023 | 7/12/2023 | -32.6%
 |
BMY Bristol-Myers Squibb | $49.81
+2.3% | Sale
$15,001 - $50,000 | 8/13/2023 | 7/12/2023 | -20.0%
 |
MKTX MarketAxess | $223.32
-0.4% | Sale
$1,001 - $15,000 | 8/13/2023 | 7/12/2023 | -10.9%
 |
MAA Mid-America Apartment Communities | $124.52
+0.0% | Sale
$15,001 - $50,000 | 8/13/2023 | 7/12/2023 | -20.8%
 |
TEAM Atlassian | $218.76
+3.0% | Sale
$15,001 - $50,000 | 8/13/2023 | 7/12/2023 | +24.8%
 |
MO Altria Group | $40.11
+0.0% | Sale
$1,001 - $15,000 | 8/13/2023 | 7/12/2023 | -12.2%
 |
CTRE CareTrust REIT | $22.50
+7.1% | Sale
$1,001 - $15,000 | 8/13/2023 | 7/12/2023 | +11.8%
 |
BGNE BeiGene | $146.98
+2.9% | Sale
$1,001 - $15,000 | 8/13/2023 | 7/12/2023 | -23.5%
 |
ABBV AbbVie | $174.08
-0.4% | Sale
$50,001 - $100,000 | 8/13/2023 | 7/12/2023 | +29.0%
 |
KLIC Kulicke and Soffa Industries | $50.13
+5.4% | Sale
$15,001 - $50,000 | 8/13/2023 | 7/12/2023 | -10.2%
 |
PK Park Hotels & Resorts | $15.19
-0.5% | Sale
$1,001 - $15,000 | 8/13/2023 | 7/12/2023 | +11.7%
 |
KR Kroger | $45.41
-0.1% | Sale
$15,001 - $50,000 | 8/13/2023 | 7/12/2023 | -4.1%
 |
IIPR Innovative Industrial Properties | $91.60
+0.3% | Sale
$1,001 - $15,000 | 8/13/2023 | 7/12/2023 | +20.0%
 |
INVH Invitation Homes | $33.07
+1.2% | Sale
$15,001 - $50,000 | 8/13/2023 | 7/12/2023 | -6.3%
 |
NSA National Storage Affiliates Trust | $36.83
-0.5% | Sale
$15,001 - $50,000 | 8/13/2023 | 7/12/2023 | +1.1%
 |
AAP Advance Auto Parts | $63.30
-1.3% | Sale
$1,001 - $15,000 | 8/13/2023 | 7/12/2023 | -10.5%
 |
MRK Merck & Co., Inc. | $125.45
-0.9% | Sale
$1,001 - $15,000 | 8/13/2023 | 7/12/2023 | +16.7%
 |
CFG Citizens Financial Group | $31.50
+0.4% | Sale
$15,001 - $50,000 | 8/13/2023 | 7/12/2023 | +12.0%
 |
IRT Independence Realty Trust | $14.74
-0.9% | Sale
$1,001 - $15,000 | 8/13/2023 | 7/12/2023 | -18.2%
 |
AMCR Amcor | $9.10
-0.7% | Sale
$1,001 - $15,000 | 8/13/2023 | 7/12/2023 | -8.0%
 |
PD PagerDuty | $25.16
+3.9% | Sale
$1,001 - $15,000 | 8/13/2023 | 7/12/2023 | +4.2%
 |
CNC Centene | $77.33
+1.1% | Sale
$15,001 - $50,000 | 8/13/2023 | 7/12/2023 | +21.2%
 |
KRG Kite Realty Group Trust | $21.50
-0.6% | Sale
$15,001 - $50,000 | 8/13/2023 | 7/12/2023 | -5.9%
 |
CB Chubb | $247.21
+1.2% | Sale
$15,001 - $50,000 | 8/13/2023 | 7/12/2023 | +29.9%
 |
CIEN Ciena | $56.74
+2.3% | Sale
$1,001 - $15,000 | 8/13/2023 | 7/12/2023 | +29.9%
 |
MOH Molina Healthcare | $388.67
+1.9% | Sale
$15,001 - $50,000 | 8/13/2023 | 7/12/2023 | +33.2%
 |
KRC Kilroy Realty | $34.72
-0.7% | Sale
$15,001 - $50,000 | 8/13/2023 | 7/12/2023 | +5.9%
 |
MTB M&T Bank | $133.33
+1.3% | Sale
$50,001 - $100,000 | 8/13/2023 | 7/12/2023 | +1.4%
 |
LUMN Lumen Technologies | $1.52
+1.3% | Sale
$1,001 - $15,000 | 8/13/2023 | 7/11/2023 | -26.6%
 |
WJRYY West Japan Railway | $42.24
-0.1% | Sale
$15,001 - $50,000 | 8/13/2023 | 7/10/2023 | +2.4%
 |
DNZOY DENSO | $17.32
+1.4% | Sale
$50,001 - $100,000 | 8/13/2023 | 7/10/2023 | +3.1%
 |
SNN Smith & Nephew | $27.84
-0.5% | Sale
$15,001 - $50,000 | 8/13/2023 | 7/10/2023 | -8.2%
 |
OVCHY Oversea-Chinese Banking | $19.19
+0.5% | Sale
$1,001 - $15,000 | 8/13/2023 | 7/10/2023 | +7.0%
 |
DNNGY Ørsted A/S | $18.91
+2.6% | Sale
$1,001 - $15,000 | 8/13/2023 | 7/10/2023 | -36.5%
 |
IDEXY Industria de Diseño Textil | $21.14
+0.9% | Sale
$100,001 - $250,000 | 8/13/2023 | 7/10/2023 | +12.0%
 |
ASML ASML | $949.60
+2.9% | Sale
$100,001 - $250,000 | 8/13/2023 | 7/10/2023 | +33.8%
 |
DBOEY Deutsche Börse | $20.11
-0.7% | Sale
$15,001 - $50,000 | 8/13/2023 | 7/10/2023 | +13.6%
 |
SONVY Sonova | $64.95
+1.5% | Sale
$15,001 - $50,000 | 8/13/2023 | 7/10/2023 | +24.5%
 |
SCGLY Société Générale Société anonyme | $4.76
-2.1% | Sale
$1,001 - $15,000 | 8/13/2023 | 7/10/2023 | -7.8%
 |
VWAGY Volkswagen | $14.45
+1.1% | Sale
$1,001 - $15,000 | 8/13/2023 | 7/10/2023 | -13.5%
 |
HSBC HSBC | $39.03
-0.6% | Sale
$100,001 - $250,000 | 8/13/2023 | 7/10/2023 | -0.2%
 |
NWG NatWest Group | $5.42
-1.6% | Sale
$15,001 - $50,000 | 8/13/2023 | 7/10/2023 | -9.4%
 |
AAGIY AIA Group | $32.21
+1.2% | Sale
$100,001 - $250,000 | 8/13/2023 | 7/10/2023 | -18.5%
 |
NMR Nomura | $5.44
| Sale
$15,001 - $50,000 | 8/13/2023 | 7/10/2023 | +40.9%
 |
MUFG Mitsubishi UFJ Financial Group | $9.40
+1.7% | Sale
$50,001 - $100,000 | 8/13/2023 | 7/10/2023 | +26.6%
 |
SZKMY Suzuki Motor | $178.13
-2.2% | Sale
$15,001 - $50,000 | 8/13/2023 | 7/10/2023 | +17.3%
 |
HVRRY Hannover Rück | $124.34
+4.0% | Sale
$15,001 - $50,000 | 8/13/2023 | 7/10/2023 | +21.2%
 |
GBERY Geberit | $56.49
-0.4% | Sale
$15,001 - $50,000 | 8/13/2023 | 7/10/2023 | +12.4%
 |
RNMBY Rheinmetall | $72.58
+0.9% | Sale
$1,001 - $15,000 | 8/13/2023 | 7/10/2023 | +32.3%
 |
HSQVY Husqvarna AB (publ) | $15.41
+0.5% | Sale
$15,001 - $50,000 | 8/13/2023 | 7/10/2023 | -12.8%
 |
SONY Sony Group | $96.00
-0.4% | Sale
$100,001 - $250,000 | 8/13/2023 | 7/10/2023 | +5.8%
 |
ENLAY Enel | $6.32
-0.9% | Sale
$15,001 - $50,000 | 8/13/2023 | 7/10/2023 | -4.8%
 |
SUHJY Sun Hung Kai Properties | $9.18
+0.2% | Sale
$15,001 - $50,000 | 8/13/2023 | 7/10/2023 | -23.9%
 |
MSLOY Mitsui O.S.K. Lines | $16.74
+1.2% | Sale
$15,001 - $50,000 | 8/13/2023 | 7/10/2023 | +33.3%
 |
AHKSY Asahi Kasei | $13.70
-0.5% | Sale
$1,001 - $15,000 | 8/13/2023 | 7/10/2023 | 0.0%
 |
NNGRY NN Group | $19.79
+0.6% | Sale
$1,001 - $15,000 | 8/13/2023 | 7/10/2023 | +7.7%
 |
HEINY Heineken | $50.98
-1.1% | Sale
$1,001 - $15,000 | 8/13/2023 | 7/10/2023 | -1.4%
 |
NEXOY NEXON | C$17.07
-1.3% | Sale
$1,001 - $15,000 | 8/13/2023 | 7/10/2023 | -7.0%
 |
QABSY Qantas Airways | $18.72
+1.7% | Sale
$1,001 - $15,000 | 8/13/2023 | 7/10/2023 | -8.7%
 |
PANDY Pandora A/S | $39.59
+1.6% | Sale
$1,001 - $15,000 | 8/13/2023 | 7/10/2023 | +71.0%
 |
GASNY Naturgy Energy Group | $4.98
-1.1% | Sale
$1,001 - $15,000 | 8/13/2023 | 7/10/2023 | -10.7%
 |
NRILY Nomura Research Institute | $27.54
-1.3% | Sale
$1,001 - $15,000 | 8/13/2023 | 7/10/2023 | +1.0%
 |
CLPBY Coloplast A/S | $13.00
+10.2% | Sale
$1,001 - $15,000 | 8/13/2023 | 7/10/2023 | +7.7%
 |
CRARY Crédit Agricole | $6.53
-0.9% | Sale
$1,001 - $15,000 | 8/13/2023 | 7/10/2023 | +13.0%
 |
SSEZY SSE | $20.05
-0.9% | Sale
$1,001 - $15,000 | 8/13/2023 | 7/10/2023 | -9.9%
 |
PROSY Prosus | $6.38
+0.6% | Sale
$15,001 - $50,000 | 8/13/2023 | 7/10/2023 | -54.9%
 |
JTKWY Just Eat Takeaway.com | $3.10
+1.3% | Sale
$1,001 - $15,000 | 8/13/2023 | 7/10/2023 | |
SFTBY SoftBank Group | $26.76
+0.4% | Sale
$15,001 - $50,000 | 8/13/2023 | 7/10/2023 | +11.5%
 |
OPHLY Ono Pharmaceutical | $5.56
-0.5% | Sale
$1,001 - $15,000 | 8/13/2023 | 7/10/2023 | -5.8%
 |
HMC Honda Motor | $34.36
-2.3% | Sale
$15,001 - $50,000 | 8/13/2023 | 7/10/2023 | +15.1%
 |
DSCSY Disco | $29.61
-1.6% | Sale
$15,001 - $50,000 | 8/13/2023 | 7/10/2023 | +84.9%
 |
KRYAY Kerry Group | $87.38
-1.9% | Sale
$15,001 - $50,000 | 8/13/2023 | 7/10/2023 | -9.9%
 |
KIM Kimco Realty | $20.08
+0.3% | Sale
$1,001 - $15,000 | 8/13/2023 | 7/10/2023 | +1.5%
 |
DB Deutsche Bank Aktiengesellschaft | $12.54
-0.3% | Sale
$1,001 - $15,000 | 8/13/2023 | 7/10/2023 | +21.7%
 |
SCMWY Swisscom | $56.84
-1.3% | Sale
$1,001 - $15,000 | 8/13/2023 | 7/10/2023 | -7.9%
 |
KGFHY Kingfisher | $5.53
-1.1% | Sale
$1,001 - $15,000 | 8/13/2023 | 7/10/2023 | -4.5%
 |
SMFKY Smurfit Kappa Group | $40.33
+1.4% | Sale
$1,001 - $15,000 | 8/13/2023 | 7/10/2023 | +18.1%
 |
NJDCY Nidec | $9.21
+1.5% | Sale
$1,001 - $15,000 | 8/13/2023 | 7/10/2023 | -30.8%
 |
DQJCY Pan Pacific International | $22.47
+2.5% | Sale
$1,001 - $15,000 | 8/13/2023 | 7/10/2023 | +23.3%
 |
SSREY Swiss Re | $28.55
-0.5% | Sale
$1,001 - $15,000 | 8/13/2023 | 7/10/2023 | +13.7%
 |
RPT RPT Realty | $12.83
| Sale
$1,001 - $15,000 | 8/13/2023 | 7/10/2023 | +22.8%
 |
IFJPY Informa | $20.16
+0.8% | Sale
$1,001 - $15,000 | 8/13/2023 | 7/10/2023 | +11.3%
 |
ISNPY Intesa Sanpaolo | $18.13
-0.9% | Sale
$50,001 - $100,000 | 8/13/2023 | 7/10/2023 | +16.3%
 |
CMWAY Commonwealth Bank of Australia | $75.93
+0.8% | Sale
$15,001 - $50,000 | 8/13/2023 | 7/10/2023 | +14.7%
 |
SOBKY SoftBank | $12.98
+0.3% | Sale
$15,001 - $50,000 | 8/13/2023 | 7/10/2023 | +20.3%
 |
SVNLY Svenska Handelsbanken AB (publ) | $5.70
+1.8% | Sale
$1,001 - $15,000 | 8/13/2023 | 7/10/2023 | +39.0%
 |
KNBWY Kirin | $14.42
+0.3% | Sale
$1,001 - $15,000 | 8/13/2023 | 7/10/2023 | -1.6%
 |
CHEOY Cochlear | $104.90
+6.1% | Sale
$15,001 - $50,000 | 8/13/2023 | 7/10/2023 | +40.9%
 |
JAPAY Japan Tobacco | $13.16
+0.7% | Sale
$15,001 - $50,000 | 8/13/2023 | 7/10/2023 | +22.3%
 |
AJINY Ajinomoto | $38.34
-0.2% | Sale
$15,001 - $50,000 | 8/13/2023 | 7/10/2023 | -3.8%
 |
DHLGY Deutsche Post | $45.89
-0.4% | Sale
$15,001 - $50,000 | 8/13/2023 | 7/10/2023 | |
UMICY Umicore | $5.47
-1.5% | Sale
$1,001 - $15,000 | 8/13/2023 | 7/10/2023 | -21.6%
 |
SIEGY Siemens Aktiengesellschaft | $89.75
-2.2% | Sale
$15,001 - $50,000 | 8/13/2023 | 7/10/2023 | +13.1%
 |
SINGY Singapore Airlines | $10.14
+0.9% | Sale
$1,001 - $15,000 | 8/13/2023 | 7/10/2023 | -6.5%
 |
ERIC Telefonaktiebolaget LM Ericsson (publ) | $5.49
+1.9% | Sale
$1,001 - $15,000 | 8/13/2023 | 7/10/2023 | +2.0%
 |
MTSFY Mitsui Fudosan | $79.56
-0.3% | Sale
$15,001 - $50,000 | 8/13/2023 | 7/10/2023 | +34.3%
 |
SMNEY Siemens Energy | $14.88
-0.7% | Sale
$1,001 - $15,000 | 8/13/2023 | 7/10/2023 | -10.3%
 |
VEOEY Veolia Environnement | $15.85
-1.6% | Sale
$15,001 - $50,000 | 8/13/2023 | 7/10/2023 | +0.5%
 |
STLA Stellantis | $24.41
+1.5% | Sale
$15,001 - $50,000 | 8/13/2023 | 7/10/2023 | +36.4%
 |
SKHHY Sonic Healthcare | $20.85
+1.6% | Sale
$15,001 - $50,000 | 8/13/2023 | 7/10/2023 | -9.7%
 |
BURBY Burberry Group | $16.39
-1.9% | Sale
$1,001 - $15,000 | 8/13/2023 | 7/10/2023 | -37.6%
 |
WPP WPP | $49.40
-0.7% | Sale
$50,001 - $100,000 | 8/13/2023 | 7/10/2023 | -5.4%
 |
FRCOY Fast Retailing | $26.70
-1.0% | Sale
$15,001 - $50,000 | 8/13/2023 | 7/10/2023 | +8.8%
 |
YASKY YASKAWA Electric | $72.96
+0.1% | Sale
$15,001 - $50,000 | 8/13/2023 | 7/10/2023 | -14.3%
 |
ASAZY ASSA ABLOY AB (publ) | $13.56
-0.3% | Sale
$15,001 - $50,000 | 8/13/2023 | 7/10/2023 | +16.7%
 |
ARKAY Arkema | $105.02
-0.7% | Sale
$15,001 - $50,000 | 8/13/2023 | 7/10/2023 | +8.7%
 |
SAP SAP | $181.55
+0.2% | Sale
$100,001 - $250,000 | 8/13/2023 | 7/10/2023 | +34.6%
 |
VWAPY Volkswagen | 12.76
+0.6% | Sale
$15,001 - $50,000 | 8/13/2023 | 7/10/2023 | -4.5%
 |
KHNGY Kuehne + Nagel International | $65.22
+0.2% | Sale
$15,001 - $50,000 | 8/13/2023 | 7/10/2023 | +10.8%
 |
TMICY Trend Micro | $56.41
+0.4% | Sale
$1,001 - $15,000 | 8/13/2023 | 7/10/2023 | +17.2%
 |
LZAGY Lonza Group | $51.06
0.0% | Sale
$15,001 - $50,000 | 8/13/2023 | 7/10/2023 | -14.4%
 |
VLVLY AB Volvo (publ) | $24.95
+0.2% | Sale
$50,001 - $100,000 | 8/13/2023 | 7/10/2023 | +22.7%
 |
SDVKY Sandvik AB (publ) | $20.45
-1.2% | Sale
$15,001 - $50,000 | 8/13/2023 | 7/10/2023 | +8.1%
 |
ESLOY EssilorLuxottica Société anonyme | $101.73
+1.4% | Sale
$100,001 - $250,000 | 8/13/2023 | 7/10/2023 | +8.1%
 |
ATLKY Atlas Copco | $16.40
+0.7% | Sale
$15,001 - $50,000 | 8/13/2023 | 7/10/2023 | +18.2%
 |
BBVA Banco Bilbao Vizcaya Argentaria | $9.92
+1.1% | Sale
$15,001 - $50,000 | 8/13/2023 | 7/10/2023 | +30.7%
 |
WRDLY Worldline | $6.49
+2.8% | Sale
$1,001 - $15,000 | 8/13/2023 | 7/10/2023 | -64.7%
 |
HCMLY Holcim | $14.82
-1.8% | Sale
$15,001 - $50,000 | 8/13/2023 | 7/10/2023 | +15.1%
 |
STM STMicroelectronics | $46.26
+2.4% | Sale
$100,001 - $250,000 | 8/13/2023 | 7/10/2023 | -5.1%
 |
LOGI Logitech International | $85.21
+0.7% | Sale
$1,001 - $15,000 | 8/13/2023 | 7/10/2023 | +42.6%
 |
LYG Lloyds Banking Group | $2.06
+0.5% | Sale
$50,001 - $100,000 | 8/13/2023 | 7/10/2023 | -5.5%
 |
ALLE Allegion | $131.91
+1.1% | Sale
$1,001 - $15,000 | 8/13/2023 | 7/10/2023 | +11.3%
 |
DANOY Danone | $13.17
-0.6% | Sale
$15,001 - $50,000 | 8/13/2023 | 7/10/2023 | +8.6%
 |
CZMWY Carl Zeiss Meditec | $119.94
+3.7% | Sale
$1,001 - $15,000 | 8/13/2023 | 7/10/2023 | +11.7%
 |
CGEMY Capgemini | $45.47
+1.2% | Sale
$15,001 - $50,000 | 8/13/2023 | 7/10/2023 | +21.6%
 |
MSADY MS&AD Insurance Group | $20.12
-0.4% | Sale
$1,001 - $15,000 | 8/13/2023 | 7/10/2023 | +9.4%
 |
NSANY Nissan Motor | $7.60
-4.4% | Sale
$1,001 - $15,000 | 8/13/2023 | 7/10/2023 | -7.3%
 |
ALIZY Allianz | $26.27
-0.1% | Sale
$50,001 - $100,000 | 8/13/2023 | 7/10/2023 | +16.4%
 |
ZLNDY Zalando | $10.23
+0.2% | Sale
$1,001 - $15,000 | 8/13/2023 | 7/10/2023 | -25.2%
 |
TM Toyota Motor | $224.46
-0.8% | Sale
$100,001 - $250,000 | 8/13/2023 | 7/10/2023 | +40.1%
 |
OTSKY Otsuka | $18.85
-0.3% | Sale
$1,001 - $15,000 | 8/13/2023 | 7/10/2023 | +2.9%
 |
ALFVY Alfa Laval Corporate | $35.32
-1.8% | Sale
$1,001 - $15,000 | 8/13/2023 | 7/10/2023 | +2.1%
 |
KMTUY Komatsu | $28.97
-0.5% | Sale
$15,001 - $50,000 | 8/13/2023 | 7/10/2023 | +9.5%
 |
ZURVY Zurich Insurance Group | $49.33
-0.6% | Sale
$1,001 - $15,000 | 8/13/2023 | 7/10/2023 | +6.6%
 |
NTTYY Nippon Telegraph and Telephone | $30.37
+1.2% | Sale
$50,001 - $100,000 | 8/13/2023 | 7/10/2023 | +3.0%
 |
SKHSY Sekisui House | $21.95
-0.1% | Sale
$1,001 - $15,000 | 8/13/2023 | 7/10/2023 | +8.2%
 |
AMKBY A.P. Møller - Mærsk A/S | $7.86
-0.8% | Sale
$1,001 - $15,000 | 8/13/2023 | 7/10/2023 | -14.3%
 |
PSA Public Storage | $284.07
-0.3% | Sale
$1,001 - $15,000 | 8/13/2023 | 7/10/2023 | -2.4%
 |
TOTDY Toto | $25.18
+1.0% | Sale
$1,001 - $15,000 | 8/13/2023 | 7/10/2023 | -15.4%
 |
MDIBY Mediobanca Banca di Credito Finanziario | $12.59
-1.4% | Sale
$1,001 - $15,000 | 8/13/2023 | 7/10/2023 | +4.2%
 |
MZDAY Mazda Motor | $6.22
-4.5% | Sale
$1,001 - $15,000 | 8/13/2023 | 7/10/2023 | +32.3%
 |
BMRRY B&M European Value Retail | $24.97
-1.0% | Sale
$15,001 - $50,000 | 8/13/2023 | 7/10/2023 | -10.0%
 |
ATEYY Advantest | $44.90
-0.7% | Sale
$15,001 - $50,000 | 8/13/2023 | 7/10/2023 | +28.9%
 |
BAYRY Bayer Aktiengesellschaft | $7.53
| Sale
$15,001 - $50,000 | 8/13/2023 | 7/10/2023 | -44.8%
 |
MTUAY MTU Aero Engines | $117.67
+0.0% | Sale
$15,001 - $50,000 | 8/13/2023 | 7/10/2023 | -6.0%
 |
AXAHY AXA | $32.49
+0.1% | Sale
$15,001 - $50,000 | 8/13/2023 | 7/10/2023 | +16.1%
 |
GSK GSK | $41.91
+0.2% | Sale
$15,001 - $50,000 | 8/13/2023 | 7/10/2023 | +23.8%
 |
AKZOY Akzo Nobel | $24.72
-0.6% | Sale
$15,001 - $50,000 | 8/13/2023 | 7/10/2023 | -6.7%
 |
DASTY Dassault Systèmes | $47.49
-0.1% | Sale
$1,001 - $15,000 | 8/13/2023 | 7/10/2023 | +9.8%
 |
BAESY BAE Systems | $62.40
+1.4% | Sale
$1,001 - $15,000 | 8/13/2023 | 7/10/2023 | +33.5%
 |
SGIOY Shionogi & Co., Ltd. | $12.12
+1.5% | Sale
$1,001 - $15,000 | 8/13/2023 | 7/10/2023 | +18.8%
 |
HDELY Heidelberg Materials | $18.07
-1.0% | Sale
$1,001 - $15,000 | 8/13/2023 | 7/10/2023 | +20.1%
 |
GVDNY Givaudan | $82.24
-1.1% | Sale
$15,001 - $50,000 | 8/13/2023 | 7/10/2023 | +24.3%
 |
MKKGY Merck KGaA | $33.12
+1.6% | Sale
$1,001 - $15,000 | 8/13/2023 | 7/10/2023 | +3.4%
 |
KBCSY KBC Group | $32.68
+0.8% | Sale
$15,001 - $50,000 | 8/13/2023 | 7/10/2023 | -7.9%
 |
ENGIY Engie | $15.21
-1.4% | Sale
$50,001 - $100,000 | 8/13/2023 | 7/10/2023 | -7.4%
 |
DEO Diageo | $146.48
-0.8% | Sale
$50,001 - $100,000 | 8/13/2023 | 7/10/2023 | -13.5%
 |
GNGBY Getinge AB (publ) | $18.60
+0.2% | Sale
$1,001 - $15,000 | 8/13/2023 | 7/10/2023 | +11.0%
 |
SUTNY Sumitomo Mitsui Trust | $3.91
+0.3% | Sale
$1,001 - $15,000 | 8/13/2023 | 7/10/2023 | +5.1%
 |
ALC Alcon | $77.20
+0.0% | Sale
$15,001 - $50,000 | 8/13/2023 | 7/10/2023 | -6.1%
 |
TSM Taiwan Semiconductor Manufacturing | $133.11
-0.5% | Sale
$50,001 - $100,000 | 8/13/2023 | 7/10/2023 | +33.4%
 |
LRLCY L'Oréal | $90.43
-0.7% | Sale
$15,001 - $50,000 | 8/13/2023 | 7/10/2023 | +1.0%
 |
TMSNY Temenos | $101.97
+0.3% | Sale
$15,001 - $50,000 | 8/13/2023 | 7/10/2023 | +31.0%
 |
NTDOY Nintendo | $14.58
+0.8% | Sale
$15,001 - $50,000 | 8/13/2023 | 7/10/2023 | +31.1%
 |
ING ING Groep | $13.05
+1.2% | Sale
$50,001 - $100,000 | 8/13/2023 | 7/10/2023 | -3.6%
 |
SPKKY Spark New Zealand | $15.98
+0.8% | Sale
$1,001 - $15,000 | 8/13/2023 | 7/10/2023 | +2.3%
 |
AAVMY ABN AMRO Bank | $14.18
+0.5% | Sale
$1,001 - $15,000 | 8/13/2023 | 7/10/2023 | -12.0%
 |
ISUZY Isuzu Motors | $13.63
-0.4% | Sale
$1,001 - $15,000 | 8/13/2023 | 7/10/2023 | +10.8%
 |
SSMXY Sysmex | $25.68
-1.0% | Sale
$15,001 - $50,000 | 8/13/2023 | 7/10/2023 | -24.1%
 |
TAK Takeda Pharmaceutical | $14.24
+1.7% | Sale
$15,001 - $50,000 | 8/13/2023 | 7/10/2023 | -8.4%
 |
EDPFY EDP - Energias de Portugal | $40.79
-0.6% | Sale
$1,001 - $15,000 | 8/13/2023 | 7/10/2023 | -14.2%
 |
KUBTY Kubota | $72.61
-2.0% | Sale
$15,001 - $50,000 | 8/13/2023 | 7/10/2023 | +0.8%
 |
TTNDY Techtronic Industries | $53.16
-0.7% | Sale
$1,001 - $15,000 | 8/13/2023 | 7/10/2023 | +0.4%
 |
KGSPY Kingspan Group | $85.37
-0.6% | Sale
$15,001 - $50,000 | 8/13/2023 | 7/10/2023 | +36.1%
 |
FUJIY FUJIFILM | $61.43
-3.8% | Sale
$15,001 - $50,000 | 8/13/2023 | 7/10/2023 | +4.6%
 |
NCBDY BANDAI NAMCO | C$10.24
-1.8% | Sale
$1,001 - $15,000 | 8/13/2023 | 7/10/2023 | -6.7%
 |
KKPNY Koninklijke KPN | $3.46
+0.9% | Sale
$50,001 - $100,000 | 8/13/2023 | 7/10/2023 | -1.3%
 |
HOCPY HOYA | $120.99
+0.0% | Sale
$15,001 - $50,000 | 8/13/2023 | 7/10/2023 | +6.4%
 |
TCEHY Tencent | $37.06
+2.3% | Sale
$1,001 - $15,000 | 8/13/2023 | 7/10/2023 | -12.6%
 |
MQBKY Macquarie Group | $124.68
+0.2% | Sale
$50,001 - $100,000 | 8/13/2023 | 7/10/2023 | +8.3%
 |
MRAAY Murata Manufacturing | $10.12
-1.7% | Sale
$15,001 - $50,000 | 8/13/2023 | 7/10/2023 | +8.6%
 |
SE SEA | $43.51
+0.4% | Sale
$1,001 - $15,000 | 8/13/2023 | 7/10/2023 | -25.0%
 |
CHGCY Chugai Pharmaceutical | $18.23
+0.9% | Sale
$1,001 - $15,000 | 8/13/2023 | 7/10/2023 | +34.5%
 |
RIO Rio Tinto Group | $67.92
-0.3% | Sale
$100,001 - $250,000 | 8/13/2023 | 7/10/2023 | +7.5%
 |
MKTAY Makita | $25.71
-1.0% | Sale
$1,001 - $15,000 | 8/13/2023 | 7/10/2023 | -7.9%
 |
SKFRY AB SKF (publ) | $19.99
-1.8% | Sale
$1,001 - $15,000 | 8/13/2023 | 7/10/2023 | +17.4%
 |
AZN AstraZeneca | $62.26
-2.0% | Sale
$100,001 - $250,000 | 8/13/2023 | 7/10/2023 | -4.5%
 |
NTES NetEase | $106.62
+1.8% | Sale
$15,001 - $50,000 | 8/13/2023 | 7/10/2023 | +9.5%
 |
IBDRY Iberdrola | $46.33
+1.1% | Sale
$50,001 - $100,000 | 8/13/2023 | 7/10/2023 | -5.7%
 |
MELI MercadoLibre | $1,742.26
+0.5% | Sale
$1,001 - $15,000 | 8/13/2023 | 7/10/2023 | +60.3%
 |
SMNNY Shimano | $14.29
+0.9% | Sale
$15,001 - $50,000 | 8/13/2023 | 7/10/2023 | -14.9%
 |
GMAB Genmab A/S | $27.84
+0.2% | Sale
$50,001 - $100,000 | 8/13/2023 | 7/10/2023 | -26.5%
 |
NDEKY Nitto Denko | $43.75
+0.5% | Sale
$15,001 - $50,000 | 8/13/2023 | 7/10/2023 | +22.9%
 |
HTHIY Hitachi | $162.44
+1.1% | Sale
$15,001 - $50,000 | 8/13/2023 | 7/10/2023 | +29.2%
 |
HST Host Hotels & Resorts | $19.58
+0.2% | Sale
$15,001 - $50,000 | 8/13/2023 | 7/10/2023 | +10.1%
 |
DNPLY Dai Nippon Printing | $14.45
+2.5% | Sale
$1,001 - $15,000 | 8/13/2023 | 7/10/2023 | +3.1%
 |
UCBJY UCB | $50.69
+4.1% | Sale
$1,001 - $15,000 | 8/13/2023 | 7/10/2023 | +17.3%
 |
ITTOY ITOCHU Techno-Solutions | $11.30
| Sale
$1,001 - $15,000 | 8/13/2023 | 7/10/2023 | -6.8%
 |
CJPRY Central Japan Railway | $12.39
-1.1% | Sale
$15,001 - $50,000 | 8/13/2023 | 7/10/2023 | -0.1%
 |
NINOY Nikon | $9.61
-5.8% | Sale
$1,001 - $15,000 | 8/13/2023 | 7/10/2023 | -24.9%
 |
HESAY Hermès International Société en commandite par actions | $235.45
+5.1% | Sale
$100,001 - $250,000 | 8/13/2023 | 7/10/2023 | +13.9%
 |
BGNE BeiGene | $146.98
+2.9% | Sale
$1,001 - $15,000 | 8/13/2023 | 7/10/2023 | -23.7%
 |
SPXCY Singapore Exchange | $104.21
+3.1% | Sale
$1,001 - $15,000 | 8/13/2023 | 7/10/2023 | -0.1%
 |
IMBBY Imperial Brands | $24.12
+1.0% | Sale
$1,001 - $15,000 | 8/13/2023 | 7/10/2023 | +6.6%
 |
DSNKY Daiichi Sankyo | $31.23
-1.0% | Sale
$50,001 - $100,000 | 8/13/2023 | 7/10/2023 | +9.6%
 |
BNTGY Brenntag | $17.01
-2.0% | Sale
$1,001 - $15,000 | 8/13/2023 | 7/10/2023 | +11.2%
 |
SSDOY Shiseido | $28.40
+4.0% | Sale
$15,001 - $50,000 | 8/13/2023 | 7/10/2023 | -36.5%
 |
CLLNY Cellnex Telecom | $17.80
-1.2% | Sale
$15,001 - $50,000 | 8/13/2023 | 7/10/2023 | -10.5%
 |
BNPQY BNP Paribas | $28.94
-1.3% | Sale
$50,001 - $100,000 | 8/13/2023 | 7/10/2023 | -4.9%
 |
SMCAY SMC | $27.37
+0.9% | Sale
$15,001 - $50,000 | 8/13/2023 | 7/10/2023 | +1.0%
 |
IFNNY Infineon Technologies | $36.34
+2.0% | Sale
$15,001 - $50,000 | 8/13/2023 | 7/10/2023 | -9.1%
 |
MIELY Mitsubishi Electric | $28.18
+1.7% | Sale
$15,001 - $50,000 | 8/13/2023 | 7/10/2023 | -0.3%
 |
UPMMY UPM-Kymmene Oyj | $31.51
+2.1% | Sale
$15,001 - $50,000 | 8/13/2023 | 7/10/2023 | +3.6%
 |
MSSMY MISUMI Group | 7.72
+0.4% | Sale
$1,001 - $15,000 | 8/13/2023 | 7/10/2023 | -21.9%
 |
BXBLY Brambles | $19.77
+1.7% | Sale
$15,001 - $50,000 | 8/13/2023 | 7/10/2023 | +5.4%
 |
DKILY Daikin Industries,Ltd. | $14.36
+2.0% | Sale
$15,001 - $50,000 | 8/13/2023 | 7/10/2023 | -29.5%
 |
UUGRY United Utilities Group | $25.78
-0.8% | Sale
$1,001 - $15,000 | 8/13/2023 | 7/10/2023 | +4.5%
 |
BDRFY Beiersdorf Aktiengesellschaft | $29.83
+0.2% | Sale
$1,001 - $15,000 | 8/13/2023 | 7/10/2023 | +16.6%
 |
CRZBY Commerzbank | $11.29
+1.5% | Sale
$15,001 - $50,000 | 8/13/2023 | 7/10/2023 | -2.3%
 |
ABBNY ABB | $43.66
+0.3% | Sale
$100,001 - $250,000 | 8/13/2023 | 7/10/2023 | +15.5%
 |
SMTOY Sumitomo Electric Industries | $13.94
+0.6% | Sale
$1,001 - $15,000 | 8/13/2023 | 7/10/2023 | +16.1%
 |
JSAIY J Sainsbury | $13.06
-0.5% | Sale
$1,001 - $15,000 | 8/13/2023 | 7/10/2023 | -4.7%
 |
NGG National Grid | $64.22
-1.0% | Sale
$50,001 - $100,000 | 8/13/2023 | 7/10/2023 | -0.3%
 |
NCMGY Newcrest Mining | $15.59
+2.8% | Sale
$15,001 - $50,000 | 8/13/2023 | 7/10/2023 | -13.0%
 |
IHG InterContinental Hotels Group | $97.99
+0.5% | Sale
$15,001 - $50,000 | 8/13/2023 | 7/10/2023 | +40.9%
 |
MGDDY Compagnie Générale des Établissements Michelin Société en commandite par actions | $16.70
-0.8% | Sale
$15,001 - $50,000 | 8/13/2023 | 7/10/2023 | +15.6%
 |
MFG Mizuho Financial Group | $3.63
+0.8% | Sale
$15,001 - $50,000 | 8/13/2023 | 7/10/2023 | +15.1%
 |
BVVBY Bureau Veritas | C$53.34
-0.1% | Sale
$1,001 - $15,000 | 8/13/2023 | 7/10/2023 | +4.0%
 |
BRDCY Bridgestone | $21.29
+0.2% | Sale
$1,001 - $15,000 | 8/13/2023 | 7/10/2023 | +5.0%
 |
AHEXY Adecco Group | $20.54
-2.7% | Sale
$15,001 - $50,000 | 8/13/2023 | 7/10/2023 | +20.9%
 |
VOD Vodafone Group Public | $8.06
-1.2% | Sale
$1,001 - $15,000 | 8/13/2023 | 7/10/2023 | -11.6%
 |
ADYEY Adyen | $15.95
+3.8% | Sale
$50,001 - $100,000 | 8/13/2023 | 7/10/2023 | -1.4%
 |
SKLTY SEEK | $34.87
+2.9% | Sale
$1,001 - $15,000 | 8/13/2023 | 7/10/2023 | +17.5%
 |
UOVEY United Overseas Bank | $42.05
+0.4% | Sale
$1,001 - $15,000 | 8/13/2023 | 7/10/2023 | +2.7%
 |
CODYY Compagnie de Saint-Gobain | $14.68
+0.5% | Sale
$1,001 - $15,000 | 8/13/2023 | 7/10/2023 | +22.8%
 |
AEG Aegon | $5.79
| Sale
$15,001 - $50,000 | 8/13/2023 | 7/10/2023 | +12.2%
 |
ICL ICL Group | $4.51
-0.9% | Sale
$1,001 - $15,000 | 8/13/2023 | 7/10/2023 | -19.5%
 |
VACNY VAT Group | $47.19
+2.4% | Sale
$1,001 - $15,000 | 8/13/2023 | 7/10/2023 | +22.8%
 |
HXGBY Hexagon AB (publ) | $11.18
-0.3% | Sale
$15,001 - $50,000 | 8/13/2023 | 7/10/2023 | -3.4%
 |
HDB HDFC Bank | $53.75
+0.2% | Sale
$15,001 - $50,000 | 8/13/2023 | 7/10/2023 | -18.8%
 |
SGSOY SGS | $9.42
-0.7% | Sale
$1,001 - $15,000 | 8/13/2023 | 7/10/2023 | +3.6%
 |
HLN Haleon | $8.13
-1.7% | Sale
$15,001 - $50,000 | 8/13/2023 | 7/10/2023 | +0.1%
 |
HKXCY Hong Kong Exchanges and Clearing | $31.08
+1.4% | Sale
$15,001 - $50,000 | 8/13/2023 | 7/10/2023 | -14.7%
 |
NICE NICE | $221.10
+1.3% | Sale
$15,001 - $50,000 | 8/13/2023 | 7/10/2023 | +9.4%
 |
NRDBY Nordea Bank Abp | $11.38
-0.9% | Sale
$1,001 - $15,000 | 8/13/2023 | 7/10/2023 | +5.8%
 |
NSRGY Nestlé | $109.27
-2.3% | Sale
$250,001 - $500,000 | 8/13/2023 | 7/10/2023 | -8.0%
 |
SMFG Sumitomo Mitsui Financial Group | $10.20
+0.6% | Sale
$50,001 - $100,000 | 8/13/2023 | 7/10/2023 | +17.9%
 |
BTLCY British Land | $4.63
-2.5% | Sale
$1,001 - $15,000 | 8/13/2023 | 7/10/2023 | +21.3%
 |
ADDYY adidas | $92.98
-0.8% | Sale
$15,001 - $50,000 | 8/13/2023 | 7/10/2023 | +0.8%
 |
BTI British American Tobacco | $30.75
-2.3% | Sale
$50,001 - $100,000 | 8/13/2023 | 7/10/2023 | -6.3%
 |
CRH CRH | $73.79
-1.2% | Sale
$15,001 - $50,000 | 8/13/2023 | 7/10/2023 | +36.7%
 |
VCISY Vinci | $31.39
+0.0% | Sale
$1,001 - $15,000 | 8/13/2023 | 7/10/2023 | +11.3%
 |
NABZY National Australia Bank | $10.53
+0.3% | Sale
$1,001 - $15,000 | 8/13/2023 | 7/10/2023 | +22.4%
 |
NOK Nokia Oyj | $3.59
-2.4% | Sale
$1,001 - $15,000 | 8/13/2023 | 7/10/2023 | -14.0%
 |
CSLLY CSL | $99.41
+1.3% | Sale
$50,001 - $100,000 | 8/13/2023 | 7/10/2023 | +12.6%
 |
JHX James Hardie Industries | $38.93
+0.7% | Sale
$15,001 - $50,000 | 8/13/2023 | 7/10/2023 | +49.3%
 |
MHGVY Mowi ASA | $18.05
+1.5% | Sale
$15,001 - $50,000 | 8/13/2023 | 7/10/2023 | +12.3%
 |
SOMMY Sumitomo Chemical | $10.10
-0.1% | Sale
$1,001 - $15,000 | 8/13/2023 | 7/10/2023 | -34.2%
 |
SVNDY Seven & i | $20.61
+1.9% | Sale
$15,001 - $50,000 | 8/13/2023 | 7/10/2023 | -2.7%
 |
SMMNY Siemens Healthineers | $29.22
| Sale
$1,001 - $15,000 | 8/13/2023 | 7/10/2023 | +7.1%
 |
SXYAY Sika | $27.33
+0.3% | Sale
$50,001 - $100,000 | 8/13/2023 | 7/10/2023 | -1.4%
 |
MURGY Münchener Rückversicherungs-Gesellschaft Aktiengesellschaft in München | $43.29
+0.1% | Sale
$15,001 - $50,000 | 8/13/2023 | 7/10/2023 | +20.4%
 |
SHECY Shin-Etsu Chemical | $19.79
-0.3% | Sale
$15,001 - $50,000 | 8/13/2023 | 7/10/2023 | +23.3%
 |
CCOEY Capcom | $19.09
+0.3% | Sale
$1,001 - $15,000 | 8/13/2023 | 7/10/2023 | -2.7%
 |
UL Unilever | $50.61
-0.1% | Sale
$100,001 - $250,000 | 8/13/2023 | 7/10/2023 | -1.1%
 |
BDNNY Boliden AB (publ) | $51.82
-3.5% | Sale
$15,001 - $50,000 | 8/13/2023 | 7/10/2023 | -13.5%
 |
YARIY Yara International ASA | $16.95
+4.8% | Sale
$1,001 - $15,000 | 8/13/2023 | 7/10/2023 | -8.2%
 |
SAXPY Sampo Oyj | $21.50
+0.8% | Sale
$1,001 - $15,000 | 8/13/2023 | 7/10/2023 | -2.4%
 |
SNY Sanofi | $46.50
-0.1% | Sale
$15,001 - $50,000 | 8/13/2023 | 7/10/2023 | -10.3%
 |
RACE Ferrari | $392.56
+1.9% | Sale
$15,001 - $50,000 | 8/13/2023 | 7/10/2023 | +23.3%
 |
NVS Novartis | $101.03
-0.3% | Sale
$50,001 - $100,000 | 8/13/2023 | 7/10/2023 | +4.6%
 |
DNBBY DNB Bank ASA | $19.18
+0.9% | Sale
$15,001 - $50,000 | 8/13/2023 | 7/10/2023 | +1.7%
 |
BUD Anheuser-Busch InBev SA/NV | $64.51
-1.7% | Sale
$50,001 - $100,000 | 8/13/2023 | 7/10/2023 | +16.1%
 |
FRRVY Ferrovial | $31.00
+1.2% | Sale
$1,001 - $15,000 | 8/13/2023 | 7/10/2023 | +2.6%
 |
FBP First BanCorp. | $16.86
+2.2% | Sale
$1,001 - $15,000 | 8/13/2023 | 7/10/2023 | +33.9%
 |
AON AON | $312.56
+1.8% | Sale
$15,001 - $50,000 | 8/13/2023 | 7/10/2023 | -7.4%
 |
LVMUY LVMH Moët Hennessy - Louis Vuitton, Société Européenne | $175.00
+1.2% | Sale
$50,001 - $100,000 | 8/13/2023 | 7/10/2023 | -4.3%
 |
KSRYY KOSÉ | $12.81
+8.7% | Sale
$15,001 - $50,000 | 8/13/2023 | 7/10/2023 | -33.2%
 |
MBGYY Mercedes-Benz Group | C$17.54
+0.1% | Sale
$15,001 - $50,000 | 8/13/2023 | 7/10/2023 | -11.5%
 |
BCS Barclays | $7.32
-0.4% | Sale
$15,001 - $50,000 | 8/13/2023 | 7/10/2023 | -4.3%
 |
SAFRY Safran | $47.69
+1.2% | Sale
$100,001 - $250,000 | 8/13/2023 | 7/10/2023 | +26.9%
 |
TEZNY Terna | $23.63
-1.5% | Sale
$1,001 - $15,000 | 8/13/2023 | 7/10/2023 | -3.1%
 |
LSRCY Lasertec | $53.89
-2.5% | Sale
$15,001 - $50,000 | 8/13/2023 | 7/10/2023 | +85.2%
 |
TTDKY TDK | $52.50
-0.7% | Sale
$15,001 - $50,000 | 8/13/2023 | 7/10/2023 | +38.8%
 |
SAN Banco Santander | $3.96
+0.8% | Sale
$50,001 - $100,000 | 8/13/2023 | 7/10/2023 | +10.2%
 |
ASHTY Ashtead Group | $267.41
-0.8% | Sale
$1,001 - $15,000 | 8/13/2023 | 7/10/2023 | -0.7%
 |
PPRUY Kering | $44.79
+1.5% | Sale
$15,001 - $50,000 | 8/13/2023 | 7/10/2023 | -15.5%
 |
QBIEY QBE Insurance Group | $10.79
-0.3% | Sale
$1,001 - $15,000 | 8/13/2023 | 7/10/2023 | +3.3%
 |
DTRUY Daimler Truck | $18.62
+0.8% | Sale
$1,001 - $15,000 | 8/13/2023 | 7/10/2023 | +3.4%
 |
RTO Rentokil Initial | $25.56
-0.2% | Sale
$15,001 - $50,000 | 8/13/2023 | 7/10/2023 | -33.5%
 |
TKAMY thyssenkrupp | $5.93
-0.7% | Sale
$1,001 - $15,000 | 8/13/2023 | 7/10/2023 | -25.0%
 |
FERG Ferguson | $198.66
+0.5% | Sale
$15,001 - $50,000 | 8/13/2023 | 7/10/2023 | +28.0%
 |
EPOKY Epiroc AB (publ) | $17.56
-0.1% | Sale
$1,001 - $15,000 | 8/13/2023 | 7/10/2023 | -6.4%
 |
PUBGY Publicis Groupe | $25.90
+1.2% | Sale
$1,001 - $15,000 | 8/13/2023 | 7/10/2023 | +32.9%
 |
OMRNY OMRON | $36.10
-3.0% | Sale
$15,001 - $50,000 | 8/13/2023 | 7/10/2023 | -40.7%
 |
UBS UBS Group | $27.90
+0.4% | Sale
$100,001 - $250,000 | 8/13/2023 | 7/10/2023 | +39.2%
 |
STBFY Suntory Beverage & Food | $16.56
+0.2% | Sale
$15,001 - $50,000 | 8/13/2023 | 7/10/2023 | -7.1%
 |
TEF Telefónica | $3.86
| Sale
$15,001 - $50,000 | 8/13/2023 | 7/10/2023 | -1.4%
 |
FSUGY Fortescue | $36.91
-0.1% | Sale
$15,001 - $50,000 | 8/13/2023 | 7/10/2023 | +28.7%
 |
SYIEY Symrise | $25.71
-0.4% | Sale
$1,001 - $15,000 | 8/13/2023 | 7/10/2023 | +0.1%
 |
DTEGY Deutsche Telekom | $23.94
+0.2% | Sale
$15,001 - $50,000 | 8/13/2023 | 7/10/2023 | +12.2%
 |
SWRAY Swire Pacific | $7.81
-0.3% | Sale
$1,001 - $15,000 | 8/13/2023 | 7/10/2023 | +1.4%
 |
LGRDY Legrand | $20.18
+0.6% | Sale
$15,001 - $50,000 | 8/13/2023 | 7/10/2023 | +4.0%
 |
FMS Fresenius Medical Care | $19.54
-0.9% | Sale
$1,001 - $15,000 | 8/13/2023 | 7/10/2023 | -18.0%
 |
SBGSY Schneider Electric S.E. | $42.42
+0.4% | Sale
$15,001 - $50,000 | 8/13/2023 | 7/10/2023 | +22.0%
 |
TRUMY Terumo | $36.78
+1.8% | Sale
$1,001 - $15,000 | 8/13/2023 | 7/10/2023 | +20.9%
 |
OCDDY Ocado Group | $13.23
-1.3% | Sale
$1,001 - $15,000 | 8/13/2023 | 7/10/2023 | -11.7%
 |
FJTSY Fujitsu | $30.65
-0.7% | Sale
$15,001 - $50,000 | 8/13/2023 | 7/10/2023 | +20.4%
 |
TT Trane Technologies | $275.44
+2.0% | Sale
$15,001 - $50,000 | 8/13/2023 | 7/10/2023 | +42.3%
 |
EADSY Airbus | $40.64
-0.3% | Sale
$50,001 - $100,000 | 8/13/2023 | 7/10/2023 | +12.1%
 |
PRYMY Prysmian | $22.70
+0.4% | Sale
$1,001 - $15,000 | 8/13/2023 | 7/10/2023 | +12.3%
 |
OLCLY Oriental Land | $34.51
+1.2% | Sale
$15,001 - $50,000 | 8/13/2023 | 7/10/2023 | -12.0%
 |
ADRNY Koninklijke Ahold Delhaize | €28.33
+0.6% | Sale
$1,001 - $15,000 | 8/13/2023 | 7/10/2023 | -17.2%
 |
PUK Prudential | $20.54
-2.2% | Sale
$50,001 - $100,000 | 8/13/2023 | 7/10/2023 | -23.6%
 |
OLYMY Olympus | $14.70
+0.3% | Sale
$15,001 - $50,000 | 8/13/2023 | 7/10/2023 | -6.3%
 |
RHHBY Roche | $32.31
+0.7% | Sale
$50,001 - $100,000 | 8/13/2023 | 7/10/2023 | -13.4%
 |
AIQUY L'Air Liquide | $36.10
+0.1% | Sale
$15,001 - $50,000 | 8/13/2023 | 7/10/2023 | +5.3%
 |
DWAHY Daiwa House Industry | $29.06
-0.1% | Sale
$15,001 - $50,000 | 8/13/2023 | 7/10/2023 | +11.4%
 |
KNRRY Knorr-Bremse | $15.19
-0.4% | Sale
$1,001 - $15,000 | 8/13/2023 | 7/10/2023 | -15.0%
 |
NVO Novo Nordisk A/S | $121.20
+2.4% | Sale
$250,001 - $500,000 | 8/13/2023 | 7/10/2023 | +208.6%
 |
ARGX argenx | $401.48
+1.7% | Sale
$1,001 - $15,000 | 8/13/2023 | 7/10/2023 | +3.9%
 |
JRONY Jerónimo Martins, SGPS | $47.09
+0.5% | Sale
$1,001 - $15,000 | 8/13/2023 | 7/10/2023 | -16.9%
 |
RANJY Randstad | $28.32
+0.1% | Sale
$1,001 - $15,000 | 8/13/2023 | 7/10/2023 | +4.7%
 |
TKOMY Tokio Marine | $26.05
0.0% | Sale
$15,001 - $50,000 | 8/13/2023 | 7/10/2023 | +12.4%
 |
EBKDY Erste Group Bank | $21.17
+1.0% | Sale
$15,001 - $50,000 | 8/13/2023 | 7/10/2023 | +22.2%
 |
TLGPY Telstra Group | $12.87
-0.2% | Sale
$15,001 - $50,000 | 8/13/2023 | 7/10/2023 | -8.6%
 |
FANUY Fanuc | $13.25
-0.5% | Sale
$15,001 - $50,000 | 8/13/2023 | 7/10/2023 | -21.1%
 |
TLPFY Teleperformance | $75.12
-1.2% | Sale
$1,001 - $15,000 | 8/13/2023 | 7/10/2023 | -5.2%
 |
TEL TE Connectivity | $144.05
+0.7% | Sale
$1,001 - $15,000 | 8/13/2023 | 7/10/2023 | +2.0%
 |
TRYIY Toray Industries | $9.04
-3.2% | Sale
$1,001 - $15,000 | 8/13/2023 | 7/10/2023 | -19.7%
 |
AMADY Amadeus IT Group | $68.50
-1.4% | Sale
$15,001 - $50,000 | 8/13/2023 | 7/10/2023 | -5.9%
 |
AVVIY Aviva | $10.61
-0.7% | Sale
$1,001 - $15,000 | 8/13/2023 | 7/10/2023 | +7.9%
 |
SOAGY Sartorius Aktiengesellschaft | $73.73
-2.3% | Sale
$1,001 - $15,000 | 8/13/2023 | 7/10/2023 | +10.0%
 |
RELX Relx | $42.48
+1.7% | Sale
$50,001 - $100,000 | 8/13/2023 | 7/10/2023 | +33.9%
 |
JSGRY LIXIL | $26.21
+1.3% | Sale
$1,001 - $15,000 | 8/13/2023 | 7/10/2023 | +0.7%
 |
TOELY Tokyo Electron | $104.63
+4.4% | Sale
$15,001 - $50,000 | 8/13/2023 | 7/10/2023 | +47.4%
 |
ALPMY Astellas Pharma | $10.79
+0.6% | Sale
$15,001 - $50,000 | 8/13/2023 | 7/10/2023 | -25.1%
 |
KDDIY KDDI | $14.94
-0.5% | Sale
$15,001 - $50,000 | 8/13/2023 | 7/10/2023 | -1.8%
 |
DBSDY DBS Group | $97.04
+1.0% | Sale
$50,001 - $100,000 | 8/13/2023 | 7/10/2023 | +5.3%
 |
SWDBY Swedbank AB (publ) | SEK 19.96
-0.3% | Sale
$1,001 - $15,000 | 8/13/2023 | 7/10/2023 | +18.3%
 |
DISH DISH Network | $5.77
+1.9% | Sale
$1,001 - $15,000 | 8/13/2023 | 6/29/2023 | -13.8%
 |
PARA Paramount Global | $12.90
-0.8% | Sale
$1,001 - $15,000 | 8/13/2023 | 6/29/2023 | -19.3%
 |
LCID Lucid Group | $3.52
+0.3% | Sale
$1,001 - $15,000 | 8/13/2023 | 6/29/2023 | -48.8%
 |
MOS Mosaic | $29.92
-0.6% | Sale
$1,001 - $15,000 | 8/13/2023 | 6/29/2023 | -14.0%
 |
OLPX Olaplex | $2.10
-7.5% | Sale
$1,001 - $15,000 | 8/13/2023 | 6/29/2023 | -43.9%
 |
ATUS Altice USA | $2.04
+1.0% | Sale
$1,001 - $15,000 | 8/13/2023 | 6/29/2023 | -30.6%
 |
CHX ChampionX | $28.99
-0.3% | Sale
$1,001 - $15,000 | 8/13/2023 | 6/29/2023 | -4.8%
 |
CLF Cleveland-Cliffs | $19.87
+2.8% | Sale
$1,001 - $15,000 | 8/13/2023 | 6/29/2023 | +17.6%
 |
QS QuantumScape | $7.53
+0.4% | Sale
$1,001 - $15,000 | 8/13/2023 | 6/29/2023 | -3.9%
 |
HAL Halliburton | $34.51
-1.5% | Sale
$15,001 - $50,000 | 8/13/2023 | 6/29/2023 | +4.0%
 |
VAL Valaris | $64.65
-0.3% | Sale
$1,001 - $15,000 | 8/13/2023 | 6/29/2023 | +8.9%
 |
FTV Fortive | $82.70
+0.6% | Sale
$1,001 - $15,000 | 7/24/2023 | 6/21/2023 | +16.1%
 |
IR Ingersoll Rand | $85.90
+0.6% | Sale
$1,001 - $15,000 | 7/24/2023 | 6/21/2023 | +33.9%
 |
TEL TE Connectivity | $144.05
+0.7% | Sale
$15,001 - $50,000 | 7/24/2023 | 6/21/2023 | +6.1%
 |
TMUS T-Mobile US | $162.19
+0.8% | Purchase
$1,001 - $15,000 | 7/24/2023 | 6/9/2023 | +23.5%
 |
NTDOY Nintendo | $14.58
+0.8% | Purchase
$15,001 - $50,000 | 5/19/2023 | 4/13/2023 | +42.9%
 |
WFAFY Wesfarmers | $19.04
+1.5% | Sale
$50,001 - $100,000 | 5/19/2023 | 4/13/2023 | +8.5%
 |
WJRYY West Japan Railway | $42.24
-0.1% | Purchase
$1,001 - $15,000 | 5/19/2023 | 4/13/2023 | -1.1%
 |
QABSY Qantas Airways | $18.72
+1.7% | Purchase
$1,001 - $15,000 | 5/19/2023 | 4/13/2023 | -14.7%
 |
CJPRY Central Japan Railway | $12.39
-1.1% | Purchase
$1,001 - $15,000 | 5/19/2023 | 4/13/2023 | +2.4%
 |
SOBKY SoftBank | $12.98
+0.3% | Purchase
$1,001 - $15,000 | 5/19/2023 | 4/13/2023 | +14.0%
 |
TLGPY Telstra Group | $12.87
-0.2% | Purchase
$1,001 - $15,000 | 5/19/2023 | 4/13/2023 | -10.4%
 |
HAL Halliburton | $34.51
-1.5% | Purchase
$1,001 - $15,000 | 5/19/2023 | 4/10/2023 | +4.3%
 |
GM General Motors | $38.56
-0.2% | Sale
$1,001 - $15,000 | 5/19/2023 | 4/10/2023 | +7.9%
 |
SRPT Sarepta Therapeutics | $126.87
-0.4% | Sale
$15,001 - $50,000 | 5/19/2023 | 4/10/2023 | -9.6%
 |
DE Deere & Company | $381.29
-1.2% | Sale
$1,001 - $15,000 | 5/19/2023 | 4/10/2023 | +1.0%
 |
LC LendingClub | $8.63
+0.5% | Sale
$1,001 - $15,000 | 5/19/2023 | 4/10/2023 | +25.8%
 |
KDP Keurig Dr Pepper | $31.15
-1.1% | Sale
$15,001 - $50,000 | 5/19/2023 | 4/10/2023 | -11.6%
 |
AFRM Affirm | $43.86
-10.9% | Purchase
$1,001 - $15,000 | 5/19/2023 | 4/10/2023 | +294.1%
 |
AGNC AGNC Investment | $9.44
+1.0% | Sale
$1,001 - $15,000 | 5/19/2023 | 4/10/2023 | -5.8%
 |
ATUS Altice USA | $2.04
+1.0% | Purchase
$1,001 - $15,000 | 5/19/2023 | 4/10/2023 | -37.4%
 |
AIG American International Group | $69.12
+1.0% | Sale
$1,001 - $15,000 | 5/19/2023 | 4/10/2023 | +35.2%
 |
CAR Avis Budget Group | $168.88
+1.6% | Purchase
$1,001 - $15,000 | 5/19/2023 | 4/10/2023 | -11.4%
 |
CHX ChampionX | $28.99
-0.3% | Purchase
$1,001 - $15,000 | 5/19/2023 | 4/10/2023 | +3.5%
 |
GTLS Chart Industries | $122.24
+3.0% | Purchase
$1,001 - $15,000 | 5/19/2023 | 4/10/2023 | +9.6%
 |
CLF Cleveland-Cliffs | $19.87
+2.8% | Purchase
$1,001 - $15,000 | 5/19/2023 | 4/10/2023 | +10.8%
 |
DISH DISH Network | $5.77
+1.9% | Purchase
$1,001 - $15,000 | 5/19/2023 | 4/10/2023 | -34.9%
 |
ESRT Empire State Realty Trust | $9.84
+1.3% | Sale
$1,001 - $15,000 | 5/19/2023 | 4/10/2023 | +55.2%
 |
LNC Lincoln National | $25.64
-2.9% | Sale
$1,001 - $15,000 | 5/19/2023 | 4/10/2023 | +22.4%
 |
LUMN Lumen Technologies | $1.52
+1.3% | Purchase
$1,001 - $15,000 | 5/19/2023 | 4/10/2023 | -38.0%
 |
MPW Medical Properties Trust | $3.40
+3.7% | Purchase
$1,001 - $15,000 | 5/19/2023 | 4/10/2023 | -59.4%
 |
TAP Molson Coors Beverage | $60.23
0.0% | Sale
$1,001 - $15,000 | 5/19/2023 | 4/10/2023 | +13.3%
 |
MOS Mosaic | $29.92
-0.6% | Sale
$1,001 - $15,000 | 5/19/2023 | 4/10/2023 | -33.4%
 |
NFG National Fuel Gas | $47.68
-2.3% | Purchase
$1,001 - $15,000 | 5/19/2023 | 4/10/2023 | -17.1%
 |
NYCB New York Community Bancorp | $4.90
+16.9% | Sale
$1,001 - $15,000 | 5/19/2023 | 4/10/2023 | -44.3%
 |
NOV NOV | $17.20
-0.4% | Sale
$1,001 - $15,000 | 5/19/2023 | 4/10/2023 | -6.2%
 |
NVDA NVIDIA | $721.33
+3.6% | Purchase
$1,001 - $15,000 | 5/19/2023 | 4/10/2023 | +161.6%
 |
OLPX Olaplex | $2.10
-7.5% | Purchase
$1,001 - $15,000 | 5/19/2023 | 4/10/2023 | -49.5%
 |
OPEN Opendoor Technologies | $3.51
+5.4% | Purchase
$1,001 - $15,000 | 5/19/2023 | 4/10/2023 | +108.9%
 |
QS QuantumScape | $7.53
+0.4% | Purchase
$1,001 - $15,000 | 5/19/2023 | 4/10/2023 | +1.2%
 |
RGA Reinsurance Group of America | $167.82
+0.2% | Sale
$1,001 - $15,000 | 5/19/2023 | 4/10/2023 | +24.2%
 |
RITM Rithm Capital | $10.21
+0.9% | Sale
$1,001 - $15,000 | 5/19/2023 | 4/10/2023 | +30.9%
 |
SBRA Sabra Health Care REIT | $13.86
+3.4% | Sale
$1,001 - $15,000 | 5/19/2023 | 4/10/2023 | +20.0%
 |
SLG SL Green Realty | $44.51
-0.5% | Sale
$1,001 - $15,000 | 5/19/2023 | 4/10/2023 | +86.2%
 |
SWX Southwest Gas | $59.12
+1.2% | Sale
$1,001 - $15,000 | 5/19/2023 | 4/10/2023 | -2.5%
 |
SR Spire | $58.35
-0.2% | Sale
$1,001 - $15,000 | 5/19/2023 | 4/10/2023 | -18.2%
 |
TEX Terex | $58.85
-8.5% | Purchase
$1,001 - $15,000 | 5/19/2023 | 4/10/2023 | +37.3%
 |
TSLA Tesla | $193.57
+2.1% | Purchase
$1,001 - $15,000 | 5/19/2023 | 4/10/2023 | +4.9%
 |
THO THOR Industries | $118.42
+1.6% | Sale
$1,001 - $15,000 | 5/19/2023 | 4/10/2023 | +51.5%
 |
UGI UGI | $23.56
+0.6% | Sale
$1,001 - $15,000 | 5/19/2023 | 4/10/2023 | -32.7%
 |
UAL United Airlines | $42.33
+1.7% | Purchase
$1,001 - $15,000 | 5/19/2023 | 4/10/2023 | -1.9%
 |
X United States Steel | $46.29
-0.2% | Sale
$1,001 - $15,000 | 5/19/2023 | 4/10/2023 | +82.1%
 |
UNM Unum Group | $47.73
+0.8% | Sale
$1,001 - $15,000 | 5/19/2023 | 4/10/2023 | +21.5%
 |
VAL Valaris | $64.65
-0.3% | Purchase
$1,001 - $15,000 | 5/19/2023 | 4/10/2023 | +2.4%
 |
VNO Vornado Realty Trust | $26.45
+0.2% | Purchase
$1,001 - $15,000 | 5/19/2023 | 4/10/2023 | +72.5%
 |
W Wayfair | $52.42
+1.6% | Sale
$1,001 - $15,000 | 5/19/2023 | 4/10/2023 | +48.1%
 |
ABBV AbbVie | $174.08
-0.4% | Sale
$15,001 - $50,000 | 5/19/2023 | 4/10/2023 | +7.9%
 |
AKR Acadia Realty Trust | $16.91
-1.5% | Sale
$1,001 - $15,000 | 5/19/2023 | 4/10/2023 | +24.2%
 |
ACN Accenture | $371.67
+0.9% | Purchase
$50,001 - $100,000 | 5/19/2023 | 4/10/2023 | +31.9%
 |
ALB Albemarle | $115.78
+1.3% | Sale
$15,001 - $50,000 | 5/19/2023 | 4/10/2023 | -42.1%
 |
MO Altria Group | $40.11
+0.0% | Sale
$1,001 - $15,000 | 5/19/2023 | 4/10/2023 | -9.9%
 |
AMZN Amazon.com | $174.45
+2.7% | Purchase
$15,001 - $50,000 | 5/19/2023 | 4/10/2023 | +70.7%
 |
AAT American Assets Trust | $22.26
+0.4% | Sale
$1,001 - $15,000 | 5/19/2023 | 4/10/2023 | +22.2%
 |
AIG American International Group | $69.12
+1.0% | Sale
$15,001 - $50,000 | 5/19/2023 | 4/10/2023 | +35.2%
|
AMT American Tower | $194.44
+0.4% | Purchase
$15,001 - $50,000 | 5/19/2023 | 4/10/2023 | -6.7%
 |
FOLD Amicus Therapeutics | $13.55
+1.7% | Sale
$1,001 - $15,000 | 5/19/2023 | 4/10/2023 | +22.3%
 |
APO Apollo Global Management | $109.93
+2.3% | Sale
$15,001 - $50,000 | 5/19/2023 | 4/10/2023 | +77.7%
 |
AAPL Apple | $188.85
+0.3% | Purchase
$15,001 - $50,000 | 5/19/2023 | 4/10/2023 | +16.6%
 |
APTV Aptiv | $82.02
+0.9% | Sale
$15,001 - $50,000 | 5/19/2023 | 4/10/2023 | -21.4%
 |
ANET Arista Networks | $282.45
+2.4% | Purchase
$1,001 - $15,000 | 5/19/2023 | 4/10/2023 | +73.1%
 |
ARRY Array Technologies | $15.22
+7.5% | Sale
$1,001 - $15,000 | 5/19/2023 | 4/10/2023 | -24.7%
 |
TEAM Atlassian | $218.76
+3.0% | Purchase
$1,001 - $15,000 | 5/19/2023 | 4/10/2023 | +37.7%
 |
AXS AXIS Capital | $60.16
+2.3% | Sale
$1,001 - $15,000 | 5/19/2023 | 4/10/2023 | +10.0%
 |
BAC Bank of America | $33.07
-0.2% | Sale
$15,001 - $50,000 | 5/19/2023 | 4/10/2023 | +18.4%
 |
BILL BILL | $65.46
-13.6% | Purchase
$15,001 - $50,000 | 5/19/2023 | 4/10/2023 | -12.5%
 |
BMY Bristol-Myers Squibb | $49.81
+2.3% | Purchase
$50,001 - $100,000 | 5/19/2023 | 4/10/2023 | -29.1%
 |
CADE Cadence Bank | $26.75
+3.7% | Purchase
$1,001 - $15,000 | 5/19/2023 | 4/10/2023 | +27.6%
 |
CPT Camden Property Trust | $93.46
-0.5% | Sale
$15,001 - $50,000 | 5/19/2023 | 4/10/2023 | -10.8%
 |
COF Capital One Financial | $135.17
-0.2% | Sale
$1,001 - $15,000 | 5/19/2023 | 4/10/2023 | +42.0%
 |
CAT Caterpillar | $317.16
-1.5% | Sale
$15,001 - $50,000 | 5/19/2023 | 4/10/2023 | +47.2%
 |
CNC Centene | $77.33
+1.1% | Purchase
$15,001 - $50,000 | 5/19/2023 | 4/10/2023 | +16.6%
 |
CHPT ChargePoint | $2.15
+2.4% | Purchase
$15,001 - $50,000 | 5/19/2023 | 4/10/2023 | -77.0%
 |
CB Chubb | $247.21
+1.2% | Purchase
$15,001 - $50,000 | 5/19/2023 | 4/10/2023 | +26.1%
 |
CFG Citizens Financial Group | $31.50
+0.4% | Purchase
$15,001 - $50,000 | 5/19/2023 | 4/10/2023 | +7.5%
 |
YOU Clear Secure | $19.54
+1.2% | Sale
$1,001 - $15,000 | 5/19/2023 | 4/10/2023 | -21.7%
 |
KO Coca-Cola | $59.56
-0.5% | Purchase
$15,001 - $50,000 | 5/19/2023 | 4/10/2023 | -5.0%
 |
CTSH Cognizant Technology Solutions | $77.10
-1.5% | Purchase
$15,001 - $50,000 | 5/19/2023 | 4/10/2023 | +26.2%
 |
COLB Columbia Banking System | $18.84
+0.3% | Purchase
$15,001 - $50,000 | 5/19/2023 | 4/10/2023 | -13.9%
 |
CAG Conagra Brands | $27.40
-2.5% | Sale
$1,001 - $15,000 | 5/19/2023 | 4/10/2023 | -27.1%
 |
CONN Conn's | $4.96
+3.1% | Sale
$1,001 - $15,000 | 5/19/2023 | 4/10/2023 | -7.5%
 |
CSGP CoStar Group | $83.13
+1.7% | Purchase
$15,001 - $50,000 | 5/19/2023 | 4/10/2023 | +20.8%
 |
CCI Crown Castle | $108.40
+0.8% | Purchase
$50,001 - $100,000 | 5/19/2023 | 4/10/2023 | -19.1%
 |
CWK Cushman & Wakefield | $10.32
+1.6% | Sale
$1,001 - $15,000 | 5/19/2023 | 4/10/2023 | +7.5%
 |
CVS CVS Health | $76.32
+1.7% | Sale
$50,001 - $100,000 | 5/19/2023 | 4/10/2023 | +0.4%
 |
DDOG Datadog | $134.91
+2.6% | Sale
$15,001 - $50,000 | 5/19/2023 | 4/10/2023 | +104.0%
 |
DLR Digital Realty Trust | $147.19
+0.1% | Sale
$15,001 - $50,000 | 5/19/2023 | 4/10/2023 | +58.9%
 |
DG Dollar General | $135.21
-0.3% | Purchase
$50,001 - $100,000 | 5/19/2023 | 4/10/2023 | -37.6%
 |
DLTR Dollar Tree | $139.50
-1.0% | Purchase
$15,001 - $50,000 | 5/19/2023 | 4/10/2023 | -8.8%
 |
DNB Dun & Bradstreet | $11.09
+0.5% | Sale
$1,001 - $15,000 | 5/19/2023 | 4/10/2023 | -3.9%
 |
EWBC East West Bancorp | $69.41
+0.3% | Sale
$15,001 - $50,000 | 5/19/2023 | 4/10/2023 | +30.1%
 |
EDIT Editas Medicine | $7.45
+3.9% | Sale
$1,001 - $15,000 | 5/19/2023 | 4/10/2023 | +12.4%
 |
ENPH Enphase Energy | $122.47
+4.8% | Sale
$1,001 - $15,000 | 5/19/2023 | 4/10/2023 | -37.5%
 |
EPAM EPAM Systems | $286.27
-0.3% | Purchase
$15,001 - $50,000 | 5/19/2023 | 4/10/2023 | -1.6%
 |
EL Estée Lauder Companies | $143.34
+1.8% | Sale
$1,001 - $15,000 | 5/19/2023 | 4/10/2023 | -40.4%
 |
EXR Extra Space Storage | $143.38
-0.1% | Sale
$1,001 - $15,000 | 5/19/2023 | 4/10/2023 | -12.7%
 |
FIS Fidelity National Information Services | $61.76
+0.5% | Purchase
$15,001 - $50,000 | 5/19/2023 | 4/10/2023 | +12.9%
 |
FITB Fifth Third Bancorp | $33.65
+0.8% | Sale
$1,001 - $15,000 | 5/19/2023 | 4/10/2023 | +28.0%
 |
FCNCA First Citizens BancShares | $1,494.81
+1.1% | Purchase
$15,001 - $50,000 | 5/19/2023 | 4/10/2023 | +50.4%
 |
FLO Flowers Foods | $22.19
-5.1% | Sale
$15,001 - $50,000 | 5/19/2023 | 4/10/2023 | -18.4%
 |
FNF Fidelity National Financial | $51.22
+0.7% | Purchase
$1,001 - $15,000 | 5/19/2023 | 4/10/2023 | +47.1%
 |
F Ford Motor | $12.68
-1.2% | Sale
$15,001 - $50,000 | 5/19/2023 | 4/10/2023 | -0.3%
 |
FCEL FuelCell Energy | $1.37
+9.6% | Sale
$1,001 - $15,000 | 5/19/2023 | 4/10/2023 | -42.7%
 |
GM General Motors | $38.56
-0.2% | Sale
$15,001 - $50,000 | 5/19/2023 | 4/10/2023 | +7.9%
|
GTLB GitLab | $77.60
+1.9% | Sale
$1,001 - $15,000 | 5/19/2023 | 4/10/2023 | +131.1%
 |
HQY HealthEquity | $79.61
+2.0% | Sale
$15,001 - $50,000 | 5/19/2023 | 4/10/2023 | +38.2%
 |
HRL Hormel Foods | $29.06
-1.4% | Sale
$15,001 - $50,000 | 5/19/2023 | 4/10/2023 | -27.7%
 |
HUN Huntsman | $24.06
+0.3% | Sale
$1,001 - $15,000 | 5/19/2023 | 4/10/2023 | -10.2%
 |
IIPR Innovative Industrial Properties | $91.60
+0.3% | Sale
$1,001 - $15,000 | 5/19/2023 | 4/10/2023 | +27.0%
 |
INSP Inspire Medical Systems | $194.87
-3.5% | Sale
$1,001 - $15,000 | 5/19/2023 | 4/10/2023 | -15.9%
 |
PODD Insulet | $192.55
-2.1% | Purchase
$1,001 - $15,000 | 5/19/2023 | 4/10/2023 | -38.9%
 |
IFF International Flavors & Fragrances | $79.94
-0.7% | Purchase
$15,001 - $50,000 | 5/19/2023 | 4/10/2023 | -13.2%
 |
IQV IQVIA | $218.20
+0.6% | Sale
$15,001 - $50,000 | 5/19/2023 | 4/10/2023 | +10.8%
 |
JKHY Jack Henry & Associates | $175.93
+1.1% | Sale
$1,001 - $15,000 | 5/19/2023 | 4/10/2023 | +18.3%
 |
JBGS JBG SMITH Properties | $16.92
+0.4% | Sale
$1,001 - $15,000 | 5/19/2023 | 4/10/2023 | +13.0%
 |
JCI Johnson Controls International | $55.50
+0.7% | Sale
$15,001 - $50,000 | 5/19/2023 | 4/10/2023 | -1.5%
 |
JLL Jones Lang LaSalle | $176.99
-1.4% | Sale
$1,001 - $15,000 | 5/19/2023 | 4/10/2023 | +30.2%
 |
JPM JPMorgan Chase & Co. | $175.01
+0.1% | Sale
$50,001 - $100,000 | 5/19/2023 | 4/10/2023 | +36.8%
 |
KRTX Karuna Therapeutics | $317.14
+0.3% | Sale
$1,001 - $15,000 | 5/19/2023 | 4/10/2023 | +76.6%
 |
FWONK Formula One Group | $66.61
+0.9% | Sale
$15,001 - $50,000 | 5/19/2023 | 4/10/2023 | -11.0%
 |
LPSN LivePerson | $2.66
-0.4% | Sale
$1,001 - $15,000 | 5/19/2023 | 4/10/2023 | -43.2%
 |
MTB M&T Bank | $133.33
+1.3% | Purchase
$1,001 - $15,000 | 5/19/2023 | 4/10/2023 | +13.5%
 |
MDGL Madrigal Pharmaceuticals | $189.88
+10.8% | Sale
$1,001 - $15,000 | 5/19/2023 | 4/10/2023 | -22.6%
 |
MRVI Maravai LifeSciences | $5.52
+1.1% | Sale
$1,001 - $15,000 | 5/19/2023 | 4/10/2023 | -60.4%
 |
MKTX MarketAxess | $223.32
-0.4% | Purchase
$1,001 - $15,000 | 5/19/2023 | 4/10/2023 | -33.5%
 |
VAC Marriott Vacations Worldwide | $84.79
+0.3% | Sale
$15,001 - $50,000 | 5/19/2023 | 4/10/2023 | -35.0%
 |
MRK Merck & Co., Inc. | $125.45
-0.9% | Purchase
$1,001 - $15,000 | 5/19/2023 | 4/10/2023 | +11.4%
 |
MSFT Microsoft | $420.55
+1.6% | Purchase
$15,001 - $50,000 | 5/19/2023 | 4/10/2023 | +45.3%
 |
MLKN MillerKnoll | $27.48
+0.7% | Sale
$1,001 - $15,000 | 5/19/2023 | 4/10/2023 | +51.2%
 |
MRTX Mirati Therapeutics | $58.70
-0.2% | Sale
$1,001 - $15,000 | 5/19/2023 | 4/10/2023 | +56.7%
 |
MRNA Moderna | $87.41
-6.7% | Purchase
$50,001 - $100,000 | 5/19/2023 | 4/10/2023 | -45.4%
 |
MOH Molina Healthcare | $388.67
+1.9% | Purchase
$15,001 - $50,000 | 5/19/2023 | 4/10/2023 | +34.1%
 |
MDLZ Mondelez International | $73.17
-2.1% | Purchase
$50,001 - $100,000 | 5/19/2023 | 4/10/2023 | +3.7%
 |
MOS Mosaic | $29.92
-0.6% | Purchase
$1,001 - $15,000 | 5/19/2023 | 4/10/2023 | -33.4%
|
NDAQ Nasdaq | $57.25
+0.9% | Sale
$50,001 - $100,000 | 5/19/2023 | 4/10/2023 | +5.3%
 |
NTRA Natera | $69.74
+0.1% | Sale
$1,001 - $15,000 | 5/19/2023 | 4/10/2023 | +35.5%
 |
NEM Newmont | $32.79
-1.6% | Sale
$1,001 - $15,000 | 5/19/2023 | 4/10/2023 | -35.8%
 |
NTNX Nutanix | $58.15
-0.8% | Sale
$1,001 - $15,000 | 5/19/2023 | 4/10/2023 | +129.8%
 |
OGS ONE Gas | $60.85
+1.0% | Purchase
$1,001 - $15,000 | 5/19/2023 | 4/10/2023 | -26.4%
 |
OUT OUTFRONT Media | $12.84
-0.1% | Sale
$1,001 - $15,000 | 5/19/2023 | 4/10/2023 | -18.8%
 |
PFE Pfizer | $27.56
0.0% | Sale
$1,001 - $15,000 | 5/19/2023 | 4/10/2023 | -34.0%
 |
PLUG Plug Power | $4.33
+3.3% | Purchase
$15,001 - $50,000 | 5/19/2023 | 4/10/2023 | -53.7%
 |
QTWO Q2 | $43.20
+1.3% | Sale
$1,001 - $15,000 | 5/19/2023 | 4/10/2023 | +86.0%
 |
RNG RingCentral | $33.71
+1.0% | Sale
$1,001 - $15,000 | 5/19/2023 | 4/10/2023 | +14.8%
 |
RBA RB Global | $68.64
+1.0% | Sale
$1,001 - $15,000 | 5/19/2023 | 4/10/2023 | +20.0%
 |
ROKU Roku | $95.80
+1.2% | Purchase
$15,001 - $50,000 | 5/19/2023 | 4/10/2023 | +48.9%
 |
SBAC SBA Communications | $217.45
+0.6% | Purchase
$15,001 - $50,000 | 5/19/2023 | 4/10/2023 | -16.9%
 |
SHLS Shoals Technologies Group | $16.50
+6.9% | Sale
$1,001 - $15,000 | 5/19/2023 | 4/10/2023 | -24.3%
 |
SPG Simon Property Group | $146.93
+2.0% | Sale
$15,001 - $50,000 | 5/19/2023 | 4/10/2023 | +34.1%
 |
SYF Synchrony Financial | $38.73
-0.4% | Sale
$1,001 - $15,000 | 5/19/2023 | 4/10/2023 | +34.5%
 |
SYY Sysco | $79.55
+0.3% | Sale
$1,001 - $15,000 | 5/19/2023 | 4/10/2023 | +2.4%
 |
TFX Teleflex | $252.04
+0.3% | Purchase
$15,001 - $50,000 | 5/19/2023 | 4/10/2023 | -3.7%
 |
TSLA Tesla | $193.57
+2.1% | Purchase
$15,001 - $50,000 | 5/19/2023 | 4/10/2023 | +4.9%
|
KHC Kraft Heinz | $35.97
-1.4% | Purchase
$1,001 - $15,000 | 5/19/2023 | 4/10/2023 | -8.0%
 |
TFC Truist Financial | $35.84
+0.9% | Purchase
$15,001 - $50,000 | 5/19/2023 | 4/10/2023 | +8.0%
 |
USB U.S. Bancorp | $40.18
-0.5% | Purchase
$15,001 - $50,000 | 5/19/2023 | 4/10/2023 | +12.8%
 |
UGI UGI | $23.56
+0.6% | Sale
$1,001 - $15,000 | 5/19/2023 | 4/10/2023 | -32.7%
|
UAL United Airlines | $42.33
+1.7% | Sale
$1,001 - $15,000 | 5/19/2023 | 4/10/2023 | -1.9%
|
VTR Ventas | $45.53
+0.0% | Sale
$15,001 - $50,000 | 5/19/2023 | 4/10/2023 | +3.8%
 |
VCYT Veracyte | $25.57
+2.3% | Sale
$1,001 - $15,000 | 5/19/2023 | 4/10/2023 | +20.0%
 |
VZ Verizon Communications | $39.72
-0.5% | Sale
$15,001 - $50,000 | 5/19/2023 | 4/10/2023 | +0.9%
 |
VTRS Viatris | $11.68
+1.0% | Sale
$1,001 - $15,000 | 5/19/2023 | 4/10/2023 | +18.6%
 |
WBS Webster Financial | $46.74
+2.5% | Purchase
$15,001 - $50,000 | 5/19/2023 | 4/10/2023 | +25.2%
 |
WFC Wells Fargo & Company | $48.06
-0.6% | Sale
$50,001 - $100,000 | 5/19/2023 | 4/10/2023 | +24.4%
 |
WY Weyerhaeuser | $33.28
+0.8% | Sale
$15,001 - $50,000 | 5/19/2023 | 4/10/2023 | +9.4%
 |
WPM Wheaton Precious Metals | $45.49
-0.9% | Sale
$1,001 - $15,000 | 5/19/2023 | 4/10/2023 | -6.7%
 |
WTW Willis Towers Watson Public | $271.86
+0.6% | Sale
$1,001 - $15,000 | 5/19/2023 | 4/10/2023 | +15.8%
 |
ZTS Zoetis | $197.32
+0.8% | Sale
$1,001 - $15,000 | 5/19/2023 | 4/10/2023 | +15.5%
 |
KR Kroger | $45.41
-0.1% | Purchase
$1,001 - $15,000 | 5/19/2023 | 4/10/2023 | -7.1%
 |
ZS Zscaler | $254.93
+2.2% | Sale
$15,001 - $50,000 | 5/19/2023 | 4/10/2023 | +142.9%
 |
HUN Huntsman | $24.06
+0.3% | Sale
$1,001 - $15,000 | 5/19/2023 | 4/10/2023 | -10.2%
|
MSSMY MISUMI Group | 7.72
+0.4% | Purchase
$1,001 - $15,000 | 4/17/2023 | 3/31/2023 | -37.9%
 |
MITEY Mitsubishi Estate | $14.30
+1.7% | Sale
$15,001 - $50,000 | 4/17/2023 | 3/31/2023 | +20.6%
 |
MUFG Mitsubishi UFJ Financial Group | $9.40
+1.7% | Sale
$15,001 - $50,000 | 4/17/2023 | 3/31/2023 | +47.1%
 |
MSLOY Mitsui O.S.K. Lines | $16.74
+1.2% | Sale
$1,001 - $15,000 | 4/17/2023 | 3/31/2023 | +34.5%
 |
MFG Mizuho Financial Group | $3.63
+0.8% | Purchase
$1,001 - $15,000 | 4/17/2023 | 3/31/2023 | +28.7%
 |
MONOY MonotaRO | $9.19
-0.9% | Sale
$1,001 - $15,000 | 4/17/2023 | 3/31/2023 | -26.7%
 |
MHGVY Mowi ASA | $18.05
+1.5% | Purchase
$15,001 - $50,000 | 4/17/2023 | 3/31/2023 | -2.3%
 |
MSADY MS&AD Insurance Group | $20.12
-0.4% | Sale
$1,001 - $15,000 | 4/17/2023 | 3/31/2023 | +29.5%
 |
NWG NatWest Group | $5.42
-1.6% | Purchase
$15,001 - $50,000 | 4/17/2023 | 3/31/2023 | -17.9%
 |
NOK Nokia Oyj | $3.59
-2.4% | Purchase
$1,001 - $15,000 | 4/17/2023 | 3/31/2023 | -26.9%
 |
NRILY Nomura Research Institute | $27.54
-1.3% | Purchase
$1,001 - $15,000 | 4/17/2023 | 3/31/2023 | +16.7%
 |
NVS Novartis | $101.03
-0.3% | Purchase
$50,001 - $100,000 | 4/17/2023 | 3/31/2023 | +9.8%
 |
NTDTY NTT DATA Group | $14.53
-1.0% | Sale
$1,001 - $15,000 | 4/17/2023 | 3/31/2023 | +11.8%
 |
OCDDY Ocado Group | $13.23
-1.3% | Purchase
$1,001 - $15,000 | 4/17/2023 | 3/31/2023 | +0.4%
 |
OLYMY Olympus | $14.70
+0.3% | Sale
$1,001 - $15,000 | 4/17/2023 | 3/31/2023 | |
DNNGY Ørsted A/S | $18.91
+2.6% | Purchase
$1,001 - $15,000 | 4/17/2023 | 3/31/2023 | -33.0%
 |
OTSKY Otsuka | $18.85
-0.3% | Sale
$1,001 - $15,000 | 4/17/2023 | 3/31/2023 | +19.3%
 |
RIO Rio Tinto Group | $67.92
-0.3% | Purchase
$1,001 - $15,000 | 4/17/2023 | 3/31/2023 | -1.0%
 |
RHHBY Roche | $32.31
+0.7% | Purchase
$1,001 - $15,000 | 4/17/2023 | 3/31/2023 | -9.9%
 |
SE SEA | $43.51
+0.4% | Purchase
$1,001 - $15,000 | 4/17/2023 | 3/31/2023 | -49.7%
 |
SKLTY SEEK | $34.87
+2.9% | Purchase
$1,001 - $15,000 | 4/17/2023 | 3/31/2023 | +6.6%
 |
SGSOY SGS | $9.42
-0.7% | Sale
$1,001 - $15,000 | 4/17/2023 | 3/31/2023 | +7.2%
 |
SGIOY Shionogi & Co., Ltd. | $12.12
+1.5% | Purchase
$1,001 - $15,000 | 4/17/2023 | 3/31/2023 | +7.7%
 |
ALIZY Allianz | $26.27
-0.1% | Purchase
$1,001 - $15,000 | 4/17/2023 | 3/31/2023 | +14.0%
 |
FSUGY Fortescue | $36.91
-0.1% | Sale
$1,001 - $15,000 | 4/17/2023 | 3/31/2023 | +22.5%
 |
GMAB Genmab A/S | $27.84
+0.2% | Sale
$1,001 - $15,000 | 4/17/2023 | 3/31/2023 | -26.3%
 |
GRFS Grifols | $8.28
+1.7% | Sale
$1,001 - $15,000 | 4/17/2023 | 3/31/2023 | +12.3%
 |
HDELY Heidelberg Materials | $18.07
-1.0% | Purchase
$1,001 - $15,000 | 4/17/2023 | 3/31/2023 | +24.1%
 |
HXGBY Hexagon AB (publ) | $11.18
-0.3% | Sale
$1,001 - $15,000 | 4/17/2023 | 3/31/2023 | -2.1%
 |
ING ING Groep | $13.05
+1.2% | Purchase
$1,001 - $15,000 | 4/17/2023 | 3/31/2023 | +9.9%
 |
IHG InterContinental Hotels Group | $97.99
+0.5% | Sale
$1,001 - $15,000 | 4/17/2023 | 3/31/2023 | +47.1%
 |
JHX James Hardie Industries | $38.93
+0.7% | Purchase
$1,001 - $15,000 | 4/17/2023 | 3/31/2023 | +79.8%
 |
JAPAY Japan Tobacco | $13.16
+0.7% | Sale
$15,001 - $50,000 | 4/17/2023 | 3/31/2023 | +24.3%
 |
JTKWY Just Eat Takeaway.com | $3.10
+1.3% | Sale
$1,001 - $15,000 | 4/17/2023 | 3/31/2023 | -17.8%
 |
LYG Lloyds Banking Group | $2.06
+0.5% | Purchase
$15,001 - $50,000 | 4/17/2023 | 3/31/2023 | -11.2%
 |
MQBKY Macquarie Group | $124.68
+0.2% | Sale
$1,001 - $15,000 | 4/17/2023 | 3/31/2023 | +5.2%
 |
MBGYY Mercedes-Benz Group | C$17.54
+0.1% | Purchase
$1,001 - $15,000 | 4/17/2023 | 3/31/2023 | -8.6%
 |
ADDYY adidas | $92.98
-0.8% | Purchase
$1,001 - $15,000 | 4/17/2023 | 3/31/2023 | +5.3%
 |
SSDOY Shiseido | $28.40
+4.0% | Sale
$1,001 - $15,000 | 4/17/2023 | 3/31/2023 | -39.2%
 |
SFTBY SoftBank Group | $26.76
+0.4% | Purchase
$15,001 - $50,000 | 4/17/2023 | 3/31/2023 | +36.2%
 |
SMPNY Sompo | $26.42
+0.6% | Sale
$1,001 - $15,000 | 4/17/2023 | 3/31/2023 | +32.4%
 |
SMFG Sumitomo Mitsui Financial Group | $10.20
+0.6% | Purchase
$1,001 - $15,000 | 4/17/2023 | 3/31/2023 | +27.5%
 |
SWDBY Swedbank AB (publ) | SEK 19.96
-0.3% | Purchase
$1,001 - $15,000 | 4/17/2023 | 3/31/2023 | +22.2%
 |
SYIEY Symrise | $25.71
-0.4% | Purchase
$1,001 - $15,000 | 4/17/2023 | 3/31/2023 | -5.3%
 |
TRUMY Terumo | $36.78
+1.8% | Purchase
$1,001 - $15,000 | 4/17/2023 | 3/31/2023 | +36.3%
 |
TOTDY Toto | $25.18
+1.0% | Purchase
$1,001 - $15,000 | 4/17/2023 | 3/31/2023 | -24.7%
 |
UPMMY UPM-Kymmene Oyj | $31.51
+2.1% | Sale
$1,001 - $15,000 | 4/17/2023 | 3/31/2023 | -6.2%
 |
VACNY VAT Group | $47.19
+2.4% | Purchase
$1,001 - $15,000 | 4/17/2023 | 3/31/2023 | +29.8%
 |
VOD Vodafone Group Public | $8.06
-1.2% | Sale
$15,001 - $50,000 | 4/17/2023 | 3/31/2023 | -27.0%
 |
EBKDY Erste Group Bank | $21.17
+1.0% | Purchase
$1,001 - $15,000 | 4/17/2023 | 3/31/2023 | +29.1%
 |
ASXFY ASX | $43.84
+2.6% | Sale
$1,001 - $15,000 | 4/17/2023 | 3/31/2023 | -1.5%
 |
ATLKY Atlas Copco | $16.40
+0.7% | Purchase
$1,001 - $15,000 | 4/17/2023 | 3/31/2023 | +29.6%
 |
SAN Banco Santander | $3.96
+0.8% | Purchase
$1,001 - $15,000 | 4/17/2023 | 3/31/2023 | +7.3%
 |
BCS Barclays | $7.32
-0.4% | Sale
$15,001 - $50,000 | 4/17/2023 | 3/31/2023 | +1.8%
 |
BAYRY Bayer Aktiengesellschaft | $7.53
| Sale
$15,001 - $50,000 | 4/17/2023 | 3/31/2023 | -52.7%
 |
BNPQY BNP Paribas | $28.94
-1.3% | Sale
$1,001 - $15,000 | 4/17/2023 | 3/31/2023 | -3.0%
 |
VWAPY Volkswagen | 12.76
+0.6% | Purchase
$15,001 - $50,000 | 4/17/2023 | 3/31/2023 | -6.2%
 |
VONOY Vonovia | $14.08
-2.3% | Sale
$50,001 - $100,000 | 4/17/2023 | 3/31/2023 | +50.3%
 |
WPP WPP | $49.40
-0.7% | Purchase
$1,001 - $15,000 | 4/17/2023 | 3/31/2023 | -17.0%
 |
BHKLY BOC Hong Kong | $47.60
-0.2% | Sale
$1,001 - $15,000 | 4/17/2023 | 3/31/2023 | -23.5%
 |
BDNNY Boliden AB (publ) | $51.82
-3.5% | Purchase
$1,001 - $15,000 | 4/17/2023 | 3/31/2023 | -34.0%
 |
CJPRY Central Japan Railway | $12.39
-1.1% | Purchase
$15,001 - $50,000 | 4/17/2023 | 3/31/2023 | +3.8%
 |
CHGCY Chugai Pharmaceutical | $18.23
+0.9% | Sale
$15,001 - $50,000 | 4/17/2023 | 3/31/2023 | +48.3%
 |
CNHI CNH Industrial | $12.09
-0.7% | Sale
$1,001 - $15,000 | 4/17/2023 | 3/31/2023 | -20.8%
 |
CRZBY Commerzbank | $11.29
+1.5% | Purchase
$15,001 - $50,000 | 4/17/2023 | 3/31/2023 | +6.6%
 |
CMWAY Commonwealth Bank of Australia | $75.93
+0.8% | Sale
$100,001 - $250,000 | 4/17/2023 | 3/31/2023 | +15.3%
 |
DKILY Daikin Industries,Ltd. | $14.36
+2.0% | Purchase
$1,001 - $15,000 | 4/17/2023 | 3/31/2023 | -19.8%
 |
DBSDY DBS Group | $97.04
+1.0% | Sale
$1,001 - $15,000 | 4/17/2023 | 3/31/2023 | -2.1%
 |
DB Deutsche Bank Aktiengesellschaft | $12.54
-0.3% | Sale
$15,001 - $50,000 | 4/17/2023 | 3/31/2023 | +22.8%
 |
DPSGY Deutsche Post | $49.33
| Purchase
$15,001 - $50,000 | 4/17/2023 | 3/31/2023 | +5.5%
 |
DEO Diageo | $146.48
-0.8% | Purchase
$1,001 - $15,000 | 4/17/2023 | 3/31/2023 | -19.2%
 |
DNBBY DNB Bank ASA | $19.18
+0.9% | Sale
$15,001 - $50,000 | 4/17/2023 | 3/31/2023 | +7.1%
 |
EPOKY Epiroc AB (publ) | $17.56
-0.1% | Purchase
$1,001 - $15,000 | 4/17/2023 | 3/31/2023 | -11.3%
 |
ERIC Telefonaktiebolaget LM Ericsson (publ) | $5.49
+1.9% | Sale
$1,001 - $15,000 | 4/17/2023 | 3/31/2023 | -6.2%
 |
AEG Aegon | $5.79
| Purchase
$15,001 - $50,000 | 4/17/2023 | 3/31/2023 | +34.7%
 |
ADYEY Adyen | $15.95
+3.8% | Purchase
$15,001 - $50,000 | 4/17/2023 | 3/31/2023 | +0.7%
 |
CS Credit Suisse Group | $0.89
+1.0% | Sale
$1,001 - $15,000 | 4/17/2023 | 3/20/2023 | -6.3%
 |
FRC First Republic Bank | | Sale
$1,001 - $15,000 | 4/17/2023 | 3/15/2023 | -100.0%
 |
LLY Eli Lilly and Company | $740.16
+0.6% | Purchase
$1,001 - $15,000 | 4/17/2023 | 3/7/2023 | +138.3%
 |
ZTS Zoetis | $197.32
+0.8% | Purchase
$1,001 - $15,000 | 4/17/2023 | 3/7/2023 | +18.1%
 |
BMY Bristol-Myers Squibb | $49.81
+2.3% | Sale
$1,001 - $15,000 | 4/17/2023 | 3/7/2023 | -26.8%
 |
KO Coca-Cola | $59.56
-0.5% | Purchase
$1,001 - $15,000 | 4/17/2023 | 3/7/2023 | -0.7%
 |
CAG Conagra Brands | $27.40
-2.5% | Sale
$1,001 - $15,000 | 4/17/2023 | 3/7/2023 | -23.5%
 |
TSN Tyson Foods | $52.58
-2.6% | Purchase
$1,001 - $15,000 | 4/17/2023 | 3/7/2023 | -9.9%
 |
PM Philip Morris International | $89.12
+0.1% | Sale
$1,001 - $15,000 | 4/17/2023 | 3/7/2023 | -10.2%
 |
DAR Darling Ingredients | $41.58
+1.1% | Purchase
$1,001 - $15,000 | 4/17/2023 | 3/7/2023 | -33.0%
 |
CTLT Catalent | $56.71
+0.3% | Purchase
$1,001 - $15,000 | 4/17/2023 | 3/7/2023 | -16.4%
 |
AMT American Tower | $194.44
+0.4% | Sale
$1,001 - $15,000 | 4/17/2023 | 3/7/2023 | +1.1%
 |
OHI Omega Healthcare Investors | $30.94
+3.4% | Sale
$1,001 - $15,000 | 4/17/2023 | 3/7/2023 | +12.1%
 |
ABBV AbbVie | $174.08
-0.4% | Purchase
$1,001 - $15,000 | 4/17/2023 | 3/7/2023 | +13.8%
 |
CPB Campbell Soup | $41.99
-2.6% | Sale
$1,001 - $15,000 | 4/17/2023 | 3/7/2023 | -19.5%
 |
PFE Pfizer | $27.56
0.0% | Sale
$1,001 - $15,000 | 4/17/2023 | 3/7/2023 | -31.7%
 |
MDLZ Mondelez International | $73.17
-2.1% | Sale
$100,001 - $250,000 | 4/17/2023 | 3/6/2023 | +11.4%
 |
NFLX Netflix | $561.32
+0.5% | Sale
$1,001 - $15,000 | 4/17/2023 | 3/6/2023 | +79.9%
 |
NOC Northrop Grumman | $454.92
+0.8% | Purchase
$15,001 - $50,000 | 4/17/2023 | 3/6/2023 | -3.3%
 |
PACW PacWest Bancorp | $7.54
| Sale
$1,001 - $15,000 | 4/17/2023 | 3/6/2023 | -72.5%
 |
PAYC Paycom Software | $190.00
-2.9% | Sale
$1,001 - $15,000 | 4/17/2023 | 3/6/2023 | -35.1%
 |
PEP PepsiCo | $167.67
-3.6% | Purchase
$50,001 - $100,000 | 4/17/2023 | 3/6/2023 | -3.4%
 |
PFE Pfizer | $27.56
0.0% | Purchase
$15,001 - $50,000 | 4/17/2023 | 3/6/2023 | -33.0%
 |
PM Philip Morris International | $89.12
+0.1% | Sale
$1,001 - $15,000 | 4/17/2023 | 3/6/2023 | -11.0%
 |
PLUG Plug Power | $4.33
+3.3% | Sale
$15,001 - $50,000 | 4/17/2023 | 3/6/2023 | -68.3%
 |
PEG Public Service Enterprise Group | $58.42
+0.4% | Sale
$1,001 - $15,000 | 4/17/2023 | 3/6/2023 | -2.8%
 |
ZTS Zoetis | $197.32
+0.8% | Purchase
$1,001 - $15,000 | 4/17/2023 | 3/6/2023 | +16.3%
 |
SR Spire | $58.35
-0.2% | Sale
$1,001 - $15,000 | 4/17/2023 | 3/6/2023 | -15.2%
 |
SNOW Snowflake | $233.28
+4.7% | Sale
$1,001 - $15,000 | 4/17/2023 | 3/6/2023 | +64.2%
 |
STT State Street | $72.84
+0.6% | Purchase
$1,001 - $15,000 | 4/17/2023 | 3/6/2023 | -19.2%
 |
TSLA Tesla | $193.57
+2.1% | Purchase
$100,001 - $250,000 | 4/17/2023 | 3/6/2023 | -0.1%
 |
KHC Kraft Heinz | $35.97
-1.4% | Sale
$15,001 - $50,000 | 4/17/2023 | 3/6/2023 | -7.7%
 |
TMO Thermo Fisher Scientific | $550.75
0.0% | Purchase
$1,001 - $15,000 | 4/17/2023 | 3/6/2023 | -1.4%
 |
TSN Tyson Foods | $52.58
-2.6% | Sale
$1,001 - $15,000 | 4/17/2023 | 3/6/2023 | -10.5%
 |
USB U.S. Bancorp | $40.18
-0.5% | Sale
$1,001 - $15,000 | 4/17/2023 | 3/6/2023 | -14.7%
 |
UPS United Parcel Service | $146.26
-1.1% | Purchase
$1,001 - $15,000 | 4/17/2023 | 3/6/2023 | -21.6%
 |
UNH UnitedHealth Group | $518.22
-0.4% | Sale
$50,001 - $100,000 | 4/17/2023 | 3/6/2023 | +7.8%
 |
VZ Verizon Communications | $39.72
-0.5% | Purchase
$15,001 - $50,000 | 4/17/2023 | 3/6/2023 | +4.1%
 |
VTRS Viatris | $11.68
+1.0% | Sale
$1,001 - $15,000 | 4/17/2023 | 3/6/2023 | +7.6%
 |
EA Electronic Arts | $140.61
+1.3% | Sale
$1,001 - $15,000 | 4/17/2023 | 3/6/2023 | +24.2%
 |
ENPH Enphase Energy | $122.47
+4.8% | Purchase
$1,001 - $15,000 | 4/17/2023 | 3/6/2023 | -45.7%
 |
EQR Equity Residential | $58.86
-0.6% | Purchase
$15,001 - $50,000 | 4/17/2023 | 3/6/2023 | -6.1%
 |
EL Estée Lauder Companies | $143.34
+1.8% | Sale
$1,001 - $15,000 | 4/17/2023 | 3/6/2023 | -43.0%
 |
ES Eversource Energy | $54.98
+1.7% | Purchase
$1,001 - $15,000 | 4/17/2023 | 3/6/2023 | -27.4%
 |
EXC Exelon | $33.84
+0.3% | Purchase
$15,001 - $50,000 | 4/17/2023 | 3/6/2023 | -18.4%
 |
FIS Fidelity National Information Services | $61.76
+0.5% | Sale
$15,001 - $50,000 | 4/17/2023 | 3/6/2023 | -3.3%
 |
FLO Flowers Foods | $22.19
-5.1% | Purchase
$15,001 - $50,000 | 4/17/2023 | 3/6/2023 | -20.6%
 |
FNF Fidelity National Financial | $51.22
+0.7% | Purchase
$1,001 - $15,000 | 4/17/2023 | 3/6/2023 | +36.2%
 |
GILD Gilead Sciences | $73.67
-0.2% | Purchase
$15,001 - $50,000 | 4/17/2023 | 3/6/2023 | -9.2%
 |
SGEN Seagen | $228.74
-0.1% | Purchase
$1,001 - $15,000 | 4/17/2023 | 3/6/2023 | +29.0%
 |
SHW Sherwin-Williams | $311.74
-0.1% | Purchase
$15,001 - $50,000 | 4/17/2023 | 3/6/2023 | +38.9%
 |
SBNY Signature Bank | $0.91
-9.0% | Purchase
$1,001 - $15,000 | 4/17/2023 | 3/6/2023 | -99.2%
 |
SILK Silk Road Medical | $16.73
+0.6% | Sale
$1,001 - $15,000 | 4/17/2023 | 3/6/2023 | -65.1%
 |
SLG SL Green Realty | $44.51
-0.5% | Purchase
$15,001 - $50,000 | 4/17/2023 | 3/6/2023 | +27.6%
 |
HE Hawaiian Electric Industries | $13.09
+0.2% | Sale
$15,001 - $50,000 | 4/17/2023 | 3/6/2023 | -66.9%
 |
PEAK Healthpeak Properties | $17.34
-3.6% | Sale
$1,001 - $15,000 | 4/17/2023 | 3/6/2023 | -28.3%
 |
RJF Raymond James | $114.88
+2.5% | Sale
$15,001 - $50,000 | 4/17/2023 | 3/6/2023 | +7.3%
 |
HRL Hormel Foods | $29.06
-1.4% | Purchase
$15,001 - $50,000 | 4/17/2023 | 3/6/2023 | -28.3%
 |
HPQ HP | $28.42
+0.5% | Sale
$1,001 - $15,000 | 4/17/2023 | 3/6/2023 | -0.5%
 |
HPP Hudson Pacific Properties | $7.69
| Sale
$1,001 - $15,000 | 4/17/2023 | 3/6/2023 | -16.7%
 |
IBRX ImmunityBio | $4.58
+6.3% | Sale
$1,001 - $15,000 | 4/17/2023 | 3/6/2023 | +160.2%
 |
VNO Vornado Realty Trust | $26.45
+0.2% | Sale
$1,001 - $15,000 | 4/17/2023 | 3/6/2023 | +33.8%
 |
WM Waste Management | $188.86
-0.3% | Sale
$50,001 - $100,000 | 4/17/2023 | 3/6/2023 | +25.3%
 |
GMED Globus Medical | $52.36
-0.2% | Sale
$15,001 - $50,000 | 4/17/2023 | 3/6/2023 | -11.6%
 |
WAL Western Alliance Bancorporation | $61.57
+4.5% | Sale
$1,001 - $15,000 | 4/17/2023 | 3/6/2023 | -18.3%
 |
GO Grocery Outlet | $25.55
+1.7% | Sale
$1,001 - $15,000 | 4/17/2023 | 3/6/2023 | -6.0%
 |
WY Weyerhaeuser | $33.28
+0.8% | Sale
$15,001 - $50,000 | 4/17/2023 | 3/6/2023 | +7.3%
 |
Z Zillow Group | $54.95
-2.4% | Purchase
$15,001 - $50,000 | 4/17/2023 | 3/6/2023 | +29.5%
 |
RTN Return Energy | C$0.04
+40.0% | Purchase
$1,001 - $15,000 | 4/17/2023 | 3/6/2023 | |
RIVN Rivian Automotive | $16.68
+3.5% | Sale
$15,001 - $50,000 | 4/17/2023 | 3/6/2023 | -2.6%
 |
CRM Salesforce | $291.30
-0.2% | Purchase
$15,001 - $50,000 | 4/17/2023 | 3/6/2023 | +58.5%
 |
SRPT Sarepta Therapeutics | $126.87
-0.4% | Purchase
$15,001 - $50,000 | 4/17/2023 | 3/6/2023 | -18.7%
 |
SBAC SBA Communications | $217.45
+0.6% | Sale
$15,001 - $50,000 | 4/17/2023 | 3/6/2023 | -15.1%
 |
ELAN Elanco Animal Health | $15.97
+0.6% | Sale
$1,001 - $15,000 | 4/17/2023 | 3/6/2023 | +47.3%
 |
EW Edwards Lifesciences | $85.01
-0.9% | Purchase
$15,001 - $50,000 | 4/17/2023 | 3/6/2023 | +7.9%
 |
DEI Douglas Emmett | $13.32
-2.3% | Sale
$1,001 - $15,000 | 4/17/2023 | 3/6/2023 | -7.0%
 |
D Dominion Energy | $44.70
+1.2% | Purchase
$15,001 - $50,000 | 4/17/2023 | 3/6/2023 | -20.1%
 |
DLTR Dollar Tree | $139.50
-1.0% | Sale
$15,001 - $50,000 | 4/17/2023 | 3/6/2023 | -3.2%
 |
DG Dollar General | $135.21
-0.3% | Sale
$15,001 - $50,000 | 4/17/2023 | 3/6/2023 | -38.4%
 |
APPS Digital Turbine | $3.91
+2.6% | Sale
$1,001 - $15,000 | 4/17/2023 | 3/6/2023 | -63.6%
 |
DAL Delta Air Lines | $40.51
+0.4% | Sale
$15,001 - $50,000 | 4/17/2023 | 3/6/2023 | +5.3%
 |
SRE Sempra | $69.67
-0.2% | Sale
$15,001 - $50,000 | 4/17/2023 | 3/6/2023 | -7.8%
 |
DHR Danaher | $242.95
-1.2% | Sale
$1,001 - $15,000 | 4/17/2023 | 3/6/2023 | -2.8%
 |
CVS CVS Health | $76.32
+1.7% | Purchase
$15,001 - $50,000 | 4/17/2023 | 3/6/2023 | -8.0%
 |
CCI Crown Castle | $108.40
+0.8% | Sale
$50,001 - $100,000 | 4/17/2023 | 3/6/2023 | -16.7%
 |
CSGP CoStar Group | $83.13
+1.7% | Sale
$15,001 - $50,000 | 4/17/2023 | 3/6/2023 | +15.7%
 |
ED Consolidated Edison | $89.06
+0.4% | Purchase
$15,001 - $50,000 | 4/17/2023 | 3/6/2023 | -2.8%
 |
KO Coca-Cola | $59.56
-0.5% | Purchase
$1,001 - $15,000 | 4/17/2023 | 3/6/2023 | -1.3%
 |
CTAS Cintas | $618.22
+0.2% | Purchase
$15,001 - $50,000 | 4/17/2023 | 3/6/2023 | +39.1%
 |
CB Chubb | $247.21
+1.2% | Sale
$50,001 - $100,000 | 4/17/2023 | 3/6/2023 | +18.8%
 |
SCHW Charles Schwab | $63.37
+1.4% | Purchase
$15,001 - $50,000 | 4/17/2023 | 3/6/2023 | -17.3%
 |
CNP CenterPoint Energy | $27.53
+0.4% | Purchase
$15,001 - $50,000 | 4/17/2023 | 3/6/2023 | -3.5%
 |
CNC Centene | $77.33
+1.1% | Sale
$1,001 - $15,000 | 4/17/2023 | 3/6/2023 | +12.1%
 |
CDNA CareDx | $8.78
-0.5% | Sale
$1,001 - $15,000 | 4/17/2023 | 3/6/2023 | -17.6%
 |
BRO Brown & Brown | $81.00
+1.3% | Purchase
$1,001 - $15,000 | 4/17/2023 | 3/6/2023 | +42.1%
 |
BMY Bristol-Myers Squibb | $49.81
+2.3% | Sale
$100,001 - $250,000 | 4/17/2023 | 3/6/2023 | -27.7%
 |
BXP Boston Properties | $64.18
-1.4% | Purchase
$15,001 - $50,000 | 4/17/2023 | 3/6/2023 | -3.0%
 |
BLNK Blink Charging | $2.79
+1.8% | Sale
$1,001 - $15,000 | 4/17/2023 | 3/6/2023 | -68.6%
 |
BLK BlackRock | $797.21
+0.5% | Sale
$1,001 - $15,000 | 4/17/2023 | 3/6/2023 | +15.8%
 |
BMRN BioMarin Pharmaceutical | $88.46
+0.4% | Sale
$1,001 - $15,000 | 4/17/2023 | 3/6/2023 | -6.2%
 |
BIIB Biogen | $240.98
+0.3% | Sale
$1,001 - $15,000 | 4/17/2023 | 3/6/2023 | -10.8%
 |
BILL BILL | $65.46
-13.6% | Sale
$15,001 - $50,000 | 4/17/2023 | 3/6/2023 | -26.3%
 |
AVB AvalonBay Communities | $174.63
+0.1% | Purchase
$15,001 - $50,000 | 4/17/2023 | 3/6/2023 | 0.0%
 |
ATO Atmos Energy | $113.11
+0.2% | Sale
$1,001 - $15,000 | 4/17/2023 | 3/6/2023 | -0.3%
 |
ADM Archer-Daniels-Midland | $53.05
+0.7% | Purchase
$50,001 - $100,000 | 4/17/2023 | 3/6/2023 | -34.8%
 |
AAPL Apple | $188.85
+0.3% | Purchase
$15,001 - $50,000 | 4/17/2023 | 3/6/2023 | +22.8%
 |
AON AON | $312.56
+1.8% | Purchase
$15,001 - $50,000 | 4/17/2023 | 3/6/2023 | +2.4%
 |
NLY Annaly Capital Management | $18.92
+0.6% | Sale
$1,001 - $15,000 | 4/17/2023 | 3/6/2023 | -7.0%
 |
AMT American Tower | $194.44
+0.4% | Sale
$50,001 - $100,000 | 4/17/2023 | 3/6/2023 | -2.1%
 |
AMZN Amazon.com | $174.45
+2.7% | Sale
$50,001 - $100,000 | 4/17/2023 | 3/6/2023 | +86.1%
 |
GOOGL Alphabet | $149.00
+2.1% | Purchase
$15,001 - $50,000 | 4/17/2023 | 3/6/2023 | +56.6%
 |
ALNY Alnylam Pharmaceuticals | $170.03
+0.3% | Purchase
$15,001 - $50,000 | 4/17/2023 | 3/6/2023 | -14.9%
 |
ALLY Ally Financial | $36.09
-0.3% | Sale
$15,001 - $50,000 | 4/17/2023 | 3/6/2023 | +20.1%
 |
ARE Alexandria Real Estate Equities | $116.20
-1.4% | Purchase
$50,001 - $100,000 | 4/17/2023 | 3/6/2023 | -20.2%
 |
INCY Incyte | $57.66
+0.5% | Sale
$1,001 - $15,000 | 4/17/2023 | 3/6/2023 | -24.0%
 |
ATVI Activision Blizzard | $94.42
-0.1% | Purchase
$1,001 - $15,000 | 4/17/2023 | 3/6/2023 | +18.6%
 |
ABT Abbott Laboratories | $111.81
-0.6% | Sale
$50,001 - $100,000 | 4/17/2023 | 3/6/2023 | +8.8%
 |
MMM 3M | $92.90
-0.3% | Purchase
$1,001 - $15,000 | 4/17/2023 | 3/6/2023 | -15.5%
 |
IFF International Flavors & Fragrances | $79.94
-0.7% | Sale
$15,001 - $50,000 | 4/17/2023 | 3/6/2023 | -12.9%
 |
ISRG Intuitive Surgical | $388.22
+0.3% | Purchase
$15,001 - $50,000 | 4/17/2023 | 3/6/2023 | +65.3%
 |
INVH Invitation Homes | $33.07
+1.2% | Purchase
$1,001 - $15,000 | 4/17/2023 | 3/6/2023 | +3.8%
 |
IONS Ionis Pharmaceuticals | $51.40
+2.8% | Sale
$1,001 - $15,000 | 4/17/2023 | 3/6/2023 | +41.8%
 |
JAZZ Jazz Pharmaceuticals | $123.43
+0.6% | Purchase
$15,001 - $50,000 | 4/17/2023 | 3/6/2023 | -13.6%
 |
JBGS JBG SMITH Properties | $16.92
+0.4% | Purchase
$1,001 - $15,000 | 4/17/2023 | 3/6/2023 | +3.7%
 |
JNJ Johnson & Johnson | $156.76
+0.2% | Purchase
$50,001 - $100,000 | 4/17/2023 | 3/6/2023 | +0.8%
 |
K Kellanova | $53.49
-2.6% | Purchase
$15,001 - $50,000 | 4/17/2023 | 3/6/2023 | -17.8%
 |
KRC Kilroy Realty | $34.72
-0.7% | Purchase
$15,001 - $50,000 | 4/17/2023 | 3/6/2023 | -5.4%
 |
KMB Kimberly-Clark | $119.81
-0.4% | Sale
$1,001 - $15,000 | 4/17/2023 | 3/6/2023 | -5.0%
 |
KIM Kimco Realty | $20.08
+0.3% | Sale
$1,001 - $15,000 | 4/17/2023 | 3/6/2023 | -2.0%
 |
KR Kroger | $45.41
-0.1% | Purchase
$1,001 - $15,000 | 4/17/2023 | 3/6/2023 | -2.3%
 |
LHX L3Harris Technologies | $209.84
+0.3% | Purchase
$1,001 - $15,000 | 4/17/2023 | 3/6/2023 | -1.9%
 |
LCID Lucid Group | $3.52
+0.3% | Sale
$15,001 - $50,000 | 4/17/2023 | 3/6/2023 | -60.1%
 |
BATRK Atlanta Braves | $40.56
| Purchase
$15,001 - $50,000 | 4/17/2023 | 3/6/2023 | +17.9%
 |
LUMN Lumen Technologies | $1.52
+1.3% | Sale
$1,001 - $15,000 | 4/17/2023 | 3/6/2023 | -53.9%
 |
NTRA Natera | $69.74
+0.1% | Purchase
$1,001 - $15,000 | 4/17/2023 | 3/6/2023 | +22.9%
 |
MTB M&T Bank | $133.33
+1.3% | Purchase
$1,001 - $15,000 | 4/17/2023 | 3/6/2023 | -12.4%
 |
VAC Marriott Vacations Worldwide | $84.79
+0.3% | Sale
$15,001 - $50,000 | 4/17/2023 | 3/6/2023 | -45.3%
 |
MMC Marsh & McLennan Companies | $197.91
+0.6% | Purchase
$1,001 - $15,000 | 4/17/2023 | 3/6/2023 | +19.8%
 |
MKC McCormick & Company, Incorporated | $64.65
-1.8% | Purchase
$1,001 - $15,000 | 4/17/2023 | 3/6/2023 | -11.7%
 |
MPW Medical Properties Trust | $3.40
+3.7% | Sale
$1,001 - $15,000 | 4/17/2023 | 3/6/2023 | -67.6%
 |
MDT Medtronic | $84.99
-1.4% | Purchase
$15,001 - $50,000 | 4/17/2023 | 3/6/2023 | +3.7%
 |
MRK Merck & Co., Inc. | $125.45
-0.9% | Sale
$15,001 - $50,000 | 4/17/2023 | 3/6/2023 | +12.9%
 |
MSFT Microsoft | $420.55
+1.6% | Purchase
$50,001 - $100,000 | 4/17/2023 | 3/6/2023 | +63.7%
 |
MRTX Mirati Therapeutics | $58.70
-0.2% | Purchase
$1,001 - $15,000 | 4/17/2023 | 3/6/2023 | +41.1%
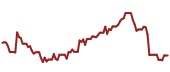 |
MRNA Moderna | $87.41
-6.7% | Sale
$50,001 - $100,000 | 4/17/2023 | 3/6/2023 | -39.3%
 |
RITM Rithm Capital | $10.21
+0.9% | Purchase
$1,001 - $15,000 | 4/17/2023 | 3/1/2023 | +12.9%
 |
AGNC AGNC Investment | $9.44
+1.0% | Sale
$1,001 - $15,000 | 4/17/2023 | 3/1/2023 | -10.9%
 |
ATUS Altice USA | $2.04
+1.0% | Sale
$1,001 - $15,000 | 4/17/2023 | 3/1/2023 | -51.5%
 |
AIG American International Group | $69.12
+1.0% | Purchase
$1,001 - $15,000 | 4/17/2023 | 3/1/2023 | +13.4%
 |
NLY Annaly Capital Management | $18.92
+0.6% | Sale
$1,001 - $15,000 | 4/17/2023 | 3/1/2023 | -6.1%
 |
CF CF Industries | $78.08
+2.1% | Sale
$1,001 - $15,000 | 4/17/2023 | 3/1/2023 | -8.3%
 |
CHX ChampionX | $28.99
-0.3% | Purchase
$1,001 - $15,000 | 4/17/2023 | 3/1/2023 | -9.5%
 |
CEG Constellation Energy | $132.17
+1.1% | Purchase
$1,001 - $15,000 | 4/17/2023 | 3/1/2023 | +77.8%
 |
DEI Douglas Emmett | $13.32
-2.3% | Sale
$1,001 - $15,000 | 4/17/2023 | 3/1/2023 | -5.9%
 |
HAL Halliburton | $34.51
-1.5% | Purchase
$1,001 - $15,000 | 4/17/2023 | 3/1/2023 | -8.0%
 |
HPP Hudson Pacific Properties | $7.69
| Sale
$1,001 - $15,000 | 4/17/2023 | 3/1/2023 | -16.0%
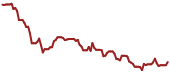 |
MPW Medical Properties Trust | $3.40
+3.7% | Sale
$1,001 - $15,000 | 4/17/2023 | 3/1/2023 | -66.2%
 |
TAP Molson Coors Beverage | $60.23
0.0% | Purchase
$1,001 - $15,000 | 4/17/2023 | 3/1/2023 | +13.5%
 |
MOS Mosaic | $29.92
-0.6% | Purchase
$1,001 - $15,000 | 4/17/2023 | 3/1/2023 | -44.9%
 |
NFG National Fuel Gas | $47.68
-2.3% | Sale
$15,001 - $50,000 | 4/17/2023 | 3/1/2023 | -16.9%
 |
NEM Newmont | $32.79
-1.6% | Sale
$1,001 - $15,000 | 4/17/2023 | 3/1/2023 | -25.6%
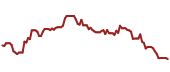 |
NOV NOV | $17.20
-0.4% | Purchase
$1,001 - $15,000 | 4/17/2023 | 3/1/2023 | -22.6%
 |
NVDA NVIDIA | $721.33
+3.6% | Purchase
$1,001 - $15,000 | 4/17/2023 | 3/1/2023 | +217.8%
 |
RGA Reinsurance Group of America | $167.82
+0.2% | Purchase
$1,001 - $15,000 | 4/17/2023 | 3/1/2023 | +14.6%
 |
SBRA Sabra Health Care REIT | $13.86
+3.4% | Purchase
$1,001 - $15,000 | 4/17/2023 | 3/1/2023 | +17.5%
 |
SLG SL Green Realty | $44.51
-0.5% | Purchase
$1,001 - $15,000 | 4/17/2023 | 3/1/2023 | +31.0%
 |
SWX Southwest Gas | $59.12
+1.2% | Purchase
$1,001 - $15,000 | 4/17/2023 | 3/1/2023 | -1.0%
 |
SR Spire | $58.35
-0.2% | Purchase
$1,001 - $15,000 | 4/17/2023 | 3/1/2023 | -17.2%
 |
RUN Sunrun | $15.82
+2.5% | Sale
$1,001 - $15,000 | 4/17/2023 | 3/1/2023 | -34.7%
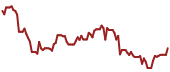 |
TSLA Tesla | $193.57
+2.1% | Purchase
$15,001 - $50,000 | 4/17/2023 | 3/1/2023 | -4.5%
 |
UGI UGI | $23.56
+0.6% | Sale
$1,001 - $15,000 | 4/17/2023 | 3/1/2023 | -36.4%
 |
X United States Steel | $46.29
-0.2% | Purchase
$1,001 - $15,000 | 4/17/2023 | 3/1/2023 | +51.1%
 |
UNM Unum Group | $47.73
+0.8% | Purchase
$1,001 - $15,000 | 4/17/2023 | 3/1/2023 | +4.7%
 |
VNO Vornado Realty Trust | $26.45
+0.2% | Sale
$1,001 - $15,000 | 4/17/2023 | 3/1/2023 | +35.1%
 |
LUMN Lumen Technologies | $1.52
+1.3% | Sale
$1,001 - $15,000 | 4/17/2023 | 3/1/2023 | -52.9%
 |
KHC Kraft Heinz | $35.97
-1.4% | Sale
$1,001 - $15,000 | 4/17/2023 | 3/1/2023 | -6.3%
 |
NRDBY Nordea Bank Abp | $11.38
-0.9% | Purchase
$1,001 - $15,000 | 3/20/2023 | 2/27/2023 | -11.8%
 |
NRILY Nomura Research Institute | $27.54
-1.3% | Sale
$15,001 - $50,000 | 3/20/2023 | 2/27/2023 | +27.3%
 |
NOK Nokia Oyj | $3.59
-2.4% | Purchase
$1,001 - $15,000 | 3/20/2023 | 2/27/2023 | -23.1%
 |
NCLTY Nitori | $14.00
+1.2% | Sale
$15,001 - $50,000 | 3/20/2023 | 2/27/2023 | +24.7%
 |
BUD Anheuser-Busch InBev SA/NV | $64.51
-1.7% | Sale
$1,001 - $15,000 | 3/20/2023 | 2/27/2023 | +6.2%
 |
ASML ASML | $949.60
+2.9% | Sale
$1,001 - $15,000 | 3/20/2023 | 2/27/2023 | +50.2%
 |
ALPMY Astellas Pharma | $10.79
+0.6% | Purchase
$15,001 - $50,000 | 3/20/2023 | 2/27/2023 | -23.4%
 |
ASXFY ASX | $43.84
+2.6% | Sale
$15,001 - $50,000 | 3/20/2023 | 2/27/2023 | -3.9%
 |
ATLKY Atlas Copco | $16.40
+0.7% | Sale
$1,001 - $15,000 | 3/20/2023 | 2/27/2023 | +38.3%
 |
BAYRY Bayer Aktiengesellschaft | $7.53
| Purchase
$15,001 - $50,000 | 3/20/2023 | 2/27/2023 | -51.6%
 |
CJPRY Central Japan Railway | $12.39
-1.1% | Sale
$15,001 - $50,000 | 3/20/2023 | 2/27/2023 | +11.1%
 |
CHGCY Chugai Pharmaceutical | $18.23
+0.9% | Purchase
$1,001 - $15,000 | 3/20/2023 | 2/27/2023 | +45.3%
 |
CRZBY Commerzbank | $11.29
+1.5% | Purchase
$1,001 - $15,000 | 3/20/2023 | 2/27/2023 | -4.4%
 |
CS Credit Suisse Group | $0.89
+1.0% | Purchase
$1,001 - $15,000 | 3/20/2023 | 2/27/2023 | -71.1%
 |
CSLLY CSL | $99.41
+1.3% | Purchase
$15,001 - $50,000 | 3/20/2023 | 2/27/2023 | -1.1%
 |
DKILY Daikin Industries,Ltd. | $14.36
+2.0% | Purchase
$15,001 - $50,000 | 3/20/2023 | 2/27/2023 | -16.7%
 |
DWAHY Daiwa House Industry | $29.06
-0.1% | Sale
$1,001 - $15,000 | 3/20/2023 | 2/27/2023 | +25.6%
 |
DEO Diageo | $146.48
-0.8% | Sale
$50,001 - $100,000 | 3/20/2023 | 2/27/2023 | -16.7%
 |
EPOKY Epiroc AB (publ) | $17.56
-0.1% | Purchase
$1,001 - $15,000 | 3/20/2023 | 2/27/2023 | -7.1%
 |
ERIC Telefonaktiebolaget LM Ericsson (publ) | $5.49
+1.9% | Purchase
$1,001 - $15,000 | 3/20/2023 | 2/27/2023 | -0.9%
 |
ESLOY EssilorLuxottica Société anonyme | $101.73
+1.4% | Sale
$1,001 - $15,000 | 3/20/2023 | 2/27/2023 | +16.6%
 |
FANUY Fanuc | $13.25
-0.5% | Purchase
$1,001 - $15,000 | 3/20/2023 | 2/27/2023 | -22.2%
 |
OLYMY Olympus | $14.70
+0.3% | Purchase
$1,001 - $15,000 | 3/20/2023 | 2/27/2023 | |
NTDTY NTT DATA Group | $14.53
-1.0% | Purchase
$1,001 - $15,000 | 3/20/2023 | 2/27/2023 | +7.2%
 |
NVS Novartis | $101.03
-0.3% | Sale
$15,001 - $50,000 | 3/20/2023 | 2/27/2023 | +18.1%
 |
STBFY Suntory Beverage & Food | $16.56
+0.2% | Purchase
$1,001 - $15,000 | 3/20/2023 | 2/27/2023 | -6.4%
 |
RTO Rentokil Initial | $25.56
-0.2% | Sale
$15,001 - $50,000 | 3/20/2023 | 2/27/2023 | -18.0%
 |
RIO Rio Tinto Group | $67.92
-0.3% | Purchase
$15,001 - $50,000 | 3/20/2023 | 2/27/2023 | -1.8%
 |
RHHBY Roche | $32.31
+0.7% | Sale
$15,001 - $50,000 | 3/20/2023 | 2/27/2023 | -12.1%
 |
OTSKY Otsuka | $18.85
-0.3% | Purchase
$1,001 - $15,000 | 3/20/2023 | 2/27/2023 | +24.0%
 |
SNY Sanofi | $46.50
-0.1% | Sale
$1,001 - $15,000 | 3/20/2023 | 2/27/2023 | -2.8%
 |
SKLTY SEEK | $34.87
+2.9% | Purchase
$1,001 - $15,000 | 3/20/2023 | 2/27/2023 | +6.6%
 |
DNNGY Ørsted A/S | $18.91
+2.6% | Purchase
$1,001 - $15,000 | 3/20/2023 | 2/27/2023 | -35.8%
 |
SVNDY Seven & i | $20.61
+1.9% | Purchase
$1,001 - $15,000 | 3/20/2023 | 2/27/2023 | -7.2%
 |
SHECY Shin-Etsu Chemical | $19.79
-0.3% | Purchase
$15,001 - $50,000 | 3/20/2023 | 2/27/2023 | +40.1%
 |
SGIOY Shionogi & Co., Ltd. | $12.12
+1.5% | Sale
$1,001 - $15,000 | 3/20/2023 | 2/27/2023 | +8.8%
 |
SSDOY Shiseido | $28.40
+4.0% | Purchase
$1,001 - $15,000 | 3/20/2023 | 2/27/2023 | -37.3%
 |
SGAPY Singapore Telecommunications | $17.40
+0.1% | Sale
$1,001 - $15,000 | 3/20/2023 | 2/27/2023 | -1.4%
 |
SMFKY Smurfit Kappa Group | $40.33
+1.4% | Sale
$1,001 - $15,000 | 3/20/2023 | 2/27/2023 | +7.1%
 |
SFTBY SoftBank Group | $26.76
+0.4% | Sale
$15,001 - $50,000 | 3/20/2023 | 2/27/2023 | +33.4%
 |
SMPNY Sompo | $26.42
+0.6% | Purchase
$1,001 - $15,000 | 3/20/2023 | 2/27/2023 | +21.7%
 |
SOMMY Sumitomo Chemical | $10.10
-0.1% | Sale
$1,001 - $15,000 | 3/20/2023 | 2/27/2023 | -43.4%
 |
OLCLY Oriental Land | $34.51
+1.2% | Purchase
$1,001 - $15,000 | 3/20/2023 | 2/27/2023 | +10.3%
 |
AJINY Ajinomoto | $38.34
-0.2% | Purchase
$1,001 - $15,000 | 3/20/2023 | 2/27/2023 | +30.1%
 |
OCDDY Ocado Group | $13.23
-1.3% | Sale
$1,001 - $15,000 | 3/20/2023 | 2/27/2023 | -11.8%
 |
QABSY Qantas Airways | $18.72
+1.7% | Purchase
$1,001 - $15,000 | 3/20/2023 | 2/27/2023 | -12.1%
 |
RCRUY Recruit | $8.16
+4.1% | Sale
$15,001 - $50,000 | 3/20/2023 | 2/27/2023 | +53.6%
 |
RELX Relx | $42.48
+1.7% | Purchase
$15,001 - $50,000 | 3/20/2023 | 2/27/2023 | +39.0%
 |
WJRYY West Japan Railway | $42.24
-0.1% | Sale
$1,001 - $15,000 | 3/20/2023 | 2/27/2023 | +9.2%
 |
VOD Vodafone Group Public | $8.06
-1.2% | Purchase
$15,001 - $50,000 | 3/20/2023 | 2/27/2023 | -33.2%
 |
ELUXY AB Electrolux (publ) | $16.98
+0.8% | Sale
$1,001 - $15,000 | 3/20/2023 | 2/27/2023 | -31.6%
 |
ADYEY Adyen | $15.95
+3.8% | Purchase
$1,001 - $15,000 | 3/20/2023 | 2/27/2023 | +12.6%
 |
UNVGY Universal Music Group | 14.82
+0.8% | Sale
$1,001 - $15,000 | 3/20/2023 | 2/27/2023 | |
UL Unilever | $50.61
-0.1% | Purchase
$1,001 - $15,000 | 3/20/2023 | 2/27/2023 | +0.2%
 |
UNICY Unicharm | $6.84
-1.4% | Sale
$15,001 - $50,000 | 3/20/2023 | 2/27/2023 | -6.6%
 |
UCBJY UCB | $50.69
+4.1% | Purchase
$1,001 - $15,000 | 3/20/2023 | 2/27/2023 | +16.3%
 |
TM Toyota Motor | $224.46
-0.8% | Sale
$1,001 - $15,000 | 3/20/2023 | 2/27/2023 | +64.7%
 |
TOTDY Toto | $25.18
+1.0% | Sale
$15,001 - $50,000 | 3/20/2023 | 2/27/2023 | -24.2%
 |
TOSYY Toshiba | $15.35
+0.3% | Sale
$1,001 - $15,000 | 3/20/2023 | 2/27/2023 | +0.3%
 |
TOELY Tokyo Electron | $104.63
+4.4% | Purchase
$15,001 - $50,000 | 3/20/2023 | 2/27/2023 | +81.7%
 |
TKOMY Tokio Marine | $26.05
0.0% | Sale
$1,001 - $15,000 | 3/20/2023 | 2/27/2023 | +22.3%
 |
TRUMY Terumo | $36.78
+1.8% | Sale
$15,001 - $50,000 | 3/20/2023 | 2/27/2023 | +35.8%
 |
TELNY Telenor ASA | $10.74
-1.2% | Purchase
$1,001 - $15,000 | 3/20/2023 | 2/27/2023 | -6.5%
 |
DQJCY Pan Pacific International | $22.47
+2.5% | Purchase
$1,001 - $15,000 | 3/20/2023 | 2/27/2023 | +21.8%
 |
FRCOY Fast Retailing | $26.70
-1.0% | Purchase
$1,001 - $15,000 | 3/20/2023 | 2/27/2023 | |
FJTSY Fujitsu | $30.65
-0.7% | Purchase
$1,001 - $15,000 | 3/20/2023 | 2/27/2023 | +20.2%
 |
NSRGY Nestlé | $109.27
-2.3% | Purchase
$15,001 - $50,000 | 3/20/2023 | 2/27/2023 | -5.6%
 |
NGG National Grid | $64.22
-1.0% | Purchase
$1,001 - $15,000 | 3/20/2023 | 2/27/2023 | +0.3%
 |
NABZY National Australia Bank | $10.53
+0.3% | Sale
$15,001 - $50,000 | 3/20/2023 | 2/27/2023 | +4.8%
 |
GVDNY Givaudan | $82.24
-1.1% | Purchase
$1,001 - $15,000 | 3/20/2023 | 2/27/2023 | +32.9%
 |
GRFS Grifols | $8.28
+1.7% | Purchase
$1,001 - $15,000 | 3/20/2023 | 2/27/2023 | -9.9%
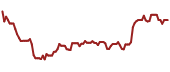 |
HLN Haleon | $8.13
-1.7% | Purchase
$1,001 - $15,000 | 3/20/2023 | 2/27/2023 | +2.7%
 |
HXGBY Hexagon AB (publ) | $11.18
-0.3% | Purchase
$1,001 - $15,000 | 3/20/2023 | 2/27/2023 | +0.1%
 |
HTHIY Hitachi | $162.44
+1.1% | Sale
$1,001 - $15,000 | 3/20/2023 | 2/27/2023 | +60.6%
 |
HOCPY HOYA | $120.99
+0.0% | Purchase
$15,001 - $50,000 | 3/20/2023 | 2/27/2023 | +24.4%
 |
HSBC HSBC | $39.03
-0.6% | Purchase
$1,001 - $15,000 | 3/20/2023 | 2/27/2023 | +2.8%
 |
IHG InterContinental Hotels Group | $97.99
+0.5% | Purchase
$1,001 - $15,000 | 3/20/2023 | 2/27/2023 | +42.9%
 |
ITTOY ITOCHU Techno-Solutions | $11.30
| Purchase
$1,001 - $15,000 | 3/20/2023 | 2/27/2023 | +0.8%
 |
JHX James Hardie Industries | $38.93
+0.7% | Purchase
$1,001 - $15,000 | 3/20/2023 | 2/27/2023 | +87.8%
 |
JAPAY Japan Tobacco | $13.16
+0.7% | Purchase
$1,001 - $15,000 | 3/20/2023 | 2/27/2023 | +28.7%
 |
KDDIY KDDI | $14.94
-0.5% | Purchase
$1,001 - $15,000 | 3/20/2023 | 2/27/2023 | +1.2%
 |
KRYAY Kerry Group | $87.38
-1.9% | Purchase
$15,001 - $50,000 | 3/20/2023 | 2/27/2023 | -10.3%
 |
KKOYY Kesko Oyj | $9.32
-2.1% | Sale
$1,001 - $15,000 | 3/20/2023 | 2/27/2023 | -13.2%
 |
KNBWY Kirin | $14.42
+0.3% | Purchase
$1,001 - $15,000 | 3/20/2023 | 2/27/2023 | -3.5%
 |
ADRNY Koninklijke Ahold Delhaize | €28.33
+0.6% | Purchase
$1,001 - $15,000 | 3/20/2023 | 2/27/2023 | -11.9%
 |
KSRYY KOSÉ | $12.81
+8.7% | Purchase
$1,001 - $15,000 | 3/20/2023 | 2/27/2023 | -41.0%
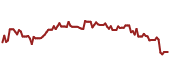 |
MBGYY Mercedes-Benz Group | C$17.54
+0.1% | Purchase
$1,001 - $15,000 | 3/20/2023 | 2/27/2023 | -8.9%
 |
MTSFY Mitsui Fudosan | $79.56
-0.3% | Sale
$1,001 - $15,000 | 3/20/2023 | 2/27/2023 | +40.5%
 |
TTNDY Techtronic Industries | $53.16
-0.7% | Purchase
$1,001 - $15,000 | 3/20/2023 | 2/27/2023 | +5.9%
 |
TSM Taiwan Semiconductor Manufacturing | $133.11
-0.5% | Sale
$50,001 - $100,000 | 3/20/2023 | 2/27/2023 | +52.5%
 |
SSMXY Sysmex | $25.68
-1.0% | Sale
$1,001 - $15,000 | 3/20/2023 | 2/27/2023 | -13.3%
 |
MSLOY Mitsui O.S.K. Lines | $16.74
+1.2% | Purchase
$15,001 - $50,000 | 3/20/2023 | 2/27/2023 | +24.5%
 |
MONOY MonotaRO | $9.19
-0.9% | Purchase
$1,001 - $15,000 | 3/20/2023 | 2/27/2023 | -31.8%
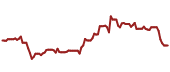 |
AAGIY AIA Group | $32.21
+1.2% | Sale
$1,001 - $15,000 | 3/20/2023 | 2/27/2023 | -23.1%
 |
NCBDY BANDAI NAMCO | C$10.24
-1.8% | Purchase
$1,001 - $15,000 | 3/20/2023 | 2/27/2023 | -0.9%
 |
MHGVY Mowi ASA | $18.05
+1.5% | Sale
$15,001 - $50,000 | 3/20/2023 | 2/27/2023 | +7.4%
 |
NJDCY Nidec | $9.21
+1.5% | Purchase
$1,001 - $15,000 | 3/20/2023 | 2/27/2023 | -26.9%
 |
NTDOY Nintendo | $14.58
+0.8% | Sale
$15,001 - $50,000 | 3/20/2023 | 2/27/2023 | +54.6%
 |
CF CF Industries | $78.08
+2.1% | Sale
$1,001 - $15,000 | 3/20/2023 | 2/3/2023 | -9.1%
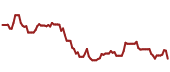 |
JNJ Johnson & Johnson | $156.76
+0.2% | Purchase
$1,001 - $15,000 | 3/20/2023 | 2/3/2023 | -4.8%
 |
TSLA Tesla | $193.57
+2.1% | Purchase
$15,001 - $50,000 | 3/20/2023 | 2/3/2023 | +1.9%
 |
LLY Eli Lilly and Company | $740.16
+0.6% | Sale
$1,001 - $15,000 | 3/20/2023 | 2/3/2023 | +118.3%
 |
BRK.B Berkshire Hathaway | $398.36
+0.2% | Sale
$1,001 - $15,000 | 3/20/2023 | 2/3/2023 | +29.1%
 |
MO Altria Group | $40.11
+0.0% | Purchase
$1,001 - $15,000 | 3/20/2023 | 2/3/2023 | -14.5%
 |
ENPH Enphase Energy | $122.47
+4.8% | Sale
$1,001 - $15,000 | 3/20/2023 | 2/3/2023 | -45.1%
 |
KO Coca-Cola | $59.56
-0.5% | Sale
$1,001 - $15,000 | 3/20/2023 | 2/3/2023 | -0.5%
 |
BAC Bank of America | $33.07
-0.2% | Sale
$1,001 - $15,000 | 2/24/2023 | 1/31/2023 | -6.8%
 |
AVGO Broadcom | $1,283.44
+0.7% | Purchase
$1,001 - $15,000 | 2/24/2023 | 1/31/2023 | +119.4%
 |
COF Capital One Financial | $135.17
-0.2% | Purchase
$1,001 - $15,000 | 2/24/2023 | 1/31/2023 | +13.6%
 |
CELH Celsius | $58.39
-0.5% | Sale
$1,001 - $15,000 | 2/24/2023 | 1/31/2023 | +74.6%
 |
CNC Centene | $77.33
+1.1% | Purchase
$1,001 - $15,000 | 2/24/2023 | 1/31/2023 | +1.4%
 |
CNP CenterPoint Energy | $27.53
+0.4% | Sale
$15,001 - $50,000 | 2/24/2023 | 1/31/2023 | -8.6%
 |
SCHW Charles Schwab | $63.37
+1.4% | Sale
$15,001 - $50,000 | 2/24/2023 | 1/31/2023 | -18.1%
 |
CHE Chemed | $589.00
-0.6% | Sale
$1,001 - $15,000 | 2/24/2023 | 1/31/2023 | +16.6%
 |
CTAS Cintas | $618.22
+0.2% | Sale
$15,001 - $50,000 | 2/24/2023 | 1/31/2023 | +39.3%
 |
CME CME Group | $205.09
+0.5% | Purchase
$1,001 - $15,000 | 2/24/2023 | 1/31/2023 | +16.1%
 |
KO Coca-Cola | $59.56
-0.5% | Sale
$50,001 - $100,000 | 2/24/2023 | 1/31/2023 | -2.9%
 |
CAG Conagra Brands | $27.40
-2.5% | Purchase
$1,001 - $15,000 | 2/24/2023 | 1/31/2023 | -26.3%
 |
CEG Constellation Energy | $132.17
+1.1% | Sale
$1,001 - $15,000 | 2/24/2023 | 1/31/2023 | +54.8%
 |
COST Costco Wholesale | $723.40
-0.1% | Sale
$15,001 - $50,000 | 2/24/2023 | 1/31/2023 | +41.5%
 |
CVS CVS Health | $76.32
+1.7% | Purchase
$1,001 - $15,000 | 2/24/2023 | 1/31/2023 | -13.5%
 |
RIVN Rivian Automotive | $16.68
+3.5% | Purchase
$15,001 - $50,000 | 2/24/2023 | 1/31/2023 | -14.0%
 |
RBLX Roblox | $44.40
-1.0% | Purchase
$15,001 - $50,000 | 2/24/2023 | 1/31/2023 | +19.3%
 |
CRM Salesforce | $291.30
-0.2% | Purchase
$100,001 - $250,000 | 2/24/2023 | 1/31/2023 | +73.4%
 |
SRPT Sarepta Therapeutics | $126.87
-0.4% | Sale
$1,001 - $15,000 | 2/24/2023 | 1/31/2023 | +1.5%
 |
SBAC SBA Communications | $217.45
+0.6% | Purchase
$15,001 - $50,000 | 2/24/2023 | 1/31/2023 | -26.9%
 |
DAL Delta Air Lines | $40.51
+0.4% | Purchase
$15,001 - $50,000 | 2/24/2023 | 1/31/2023 | +3.6%
 |
DG Dollar General | $135.21
-0.3% | Purchase
$15,001 - $50,000 | 2/24/2023 | 1/31/2023 | -42.1%
 |
DLTR Dollar Tree | $139.50
-1.0% | Purchase
$15,001 - $50,000 | 2/24/2023 | 1/31/2023 | -7.1%
 |
D Dominion Energy | $44.70
+1.2% | Purchase
$15,001 - $50,000 | 2/24/2023 | 1/31/2023 | -29.8%
 |
EWBC East West Bancorp | $69.41
+0.3% | Purchase
$15,001 - $50,000 | 2/24/2023 | 1/31/2023 | -11.6%
 |
LLY Eli Lilly and Company | $740.16
+0.6% | Purchase
$15,001 - $50,000 | 2/24/2023 | 1/31/2023 | +115.1%
 |
ENVX Enovix | $11.85
+10.7% | Sale
$1,001 - $15,000 | 2/24/2023 | 1/31/2023 | +49.2%
 |
ENPH Enphase Energy | $122.47
+4.8% | Sale
$15,001 - $50,000 | 2/24/2023 | 1/31/2023 | -44.7%
 |
EQR Equity Residential | $58.86
-0.6% | Purchase
$1,001 - $15,000 | 2/24/2023 | 1/31/2023 | -7.5%
 |
EL Estée Lauder Companies | $143.34
+1.8% | Sale
$1,001 - $15,000 | 2/24/2023 | 1/31/2023 | -48.3%
 |
FATE Fate Therapeutics | $6.29
+2.9% | Sale
$1,001 - $15,000 | 2/24/2023 | 1/31/2023 | +5.5%
 |
FITB Fifth Third Bancorp | $33.65
+0.8% | Purchase
$1,001 - $15,000 | 2/24/2023 | 1/31/2023 | -7.3%
 |
F Ford Motor | $12.68
-1.2% | Purchase
$15,001 - $50,000 | 2/24/2023 | 1/31/2023 | -6.1%
 |
GM General Motors | $38.56
-0.2% | Purchase
$15,001 - $50,000 | 2/24/2023 | 1/31/2023 | -1.9%
 |
HZNP Horizon Therapeutics Public | $116.30
| Sale
$15,001 - $50,000 | 2/24/2023 | 1/31/2023 | +6.0%
 |
HPQ HP | $28.42
+0.5% | Purchase
$1,001 - $15,000 | 2/24/2023 | 1/31/2023 | -2.5%
 |
INTC Intel | $43.31
+1.9% | Purchase
$15,001 - $50,000 | 2/24/2023 | 1/31/2023 | +53.3%
 |
ISRG Intuitive Surgical | $388.22
+0.3% | Purchase
$1,001 - $15,000 | 2/24/2023 | 1/31/2023 | +58.0%
 |
URI United Rentals | $650.35
+0.5% | Purchase
$1,001 - $15,000 | 2/24/2023 | 1/31/2023 | +47.5%
 |
JAZZ Jazz Pharmaceuticals | $123.43
+0.6% | Sale
$1,001 - $15,000 | 2/24/2023 | 1/31/2023 | -21.2%
 |
JNJ Johnson & Johnson | $156.76
+0.2% | Sale
$100,001 - $250,000 | 2/24/2023 | 1/31/2023 | -4.1%
 |
SBCF Seacoast Banking Co. of Florida | $24.72
+1.7% | Sale
$15,001 - $50,000 | 2/24/2023 | 1/31/2023 | -23.0%
 |
SHW Sherwin-Williams | $311.74
-0.1% | Purchase
$15,001 - $50,000 | 2/24/2023 | 1/31/2023 | +31.8%
 |
SWAV Shockwave Medical | $233.71
-1.3% | Sale
$1,001 - $15,000 | 2/24/2023 | 1/31/2023 | +24.4%
 |
SNOW Snowflake | $233.28
+4.7% | Sale
$1,001 - $15,000 | 2/24/2023 | 1/31/2023 | +49.1%
 |
SR Spire | $58.35
-0.2% | Purchase
$1,001 - $15,000 | 2/24/2023 | 1/31/2023 | -19.2%
 |
SPWR SunPower | $3.58
+10.8% | Sale
$1,001 - $15,000 | 2/24/2023 | 1/31/2023 | -79.5%
 |
SYNH Syneos Health | $42.98
+0.0% | Sale
$1,001 - $15,000 | 2/24/2023 | 1/31/2023 | +19.7%
 |
KDP Keurig Dr Pepper | $31.15
-1.1% | Purchase
$15,001 - $50,000 | 2/24/2023 | 1/31/2023 | -11.7%
 |
KR Kroger | $45.41
-0.1% | Sale
$1,001 - $15,000 | 2/24/2023 | 1/31/2023 | +1.7%
 |
SYY Sysco | $79.55
+0.3% | Purchase
$1,001 - $15,000 | 2/24/2023 | 1/31/2023 | +2.7%
 |
TSLA Tesla | $193.57
+2.1% | Sale
$100,001 - $250,000 | 2/24/2023 | 1/31/2023 | +11.7%
 |
TTD Trade Desk | $71.31
+1.6% | Purchase
$15,001 - $50,000 | 2/24/2023 | 1/31/2023 | +40.7%
 |
USB U.S. Bancorp | $40.18
-0.5% | Purchase
$1,001 - $15,000 | 2/24/2023 | 1/31/2023 | -19.3%
 |
UNP Union Pacific | $249.45
+0.3% | Sale
$50,001 - $100,000 | 2/24/2023 | 1/31/2023 | +22.2%
 |
UAL United Airlines | $42.33
+1.7% | Purchase
$1,001 - $15,000 | 2/24/2023 | 1/31/2023 | -13.5%
 |
ZTS Zoetis | $197.32
+0.8% | Purchase
$1,001 - $15,000 | 2/24/2023 | 1/31/2023 | +19.2%
 |
WPM Wheaton Precious Metals | $45.49
-0.9% | Sale
$1,001 - $15,000 | 2/24/2023 | 1/31/2023 | -0.5%
 |
VTRS Viatris | $11.68
+1.0% | Purchase
$1,001 - $15,000 | 2/24/2023 | 1/31/2023 | -3.9%
 |
VZ Verizon Communications | $39.72
-0.5% | Purchase
$1,001 - $15,000 | 2/24/2023 | 1/31/2023 | -4.5%
 |
VFC V.F. | $15.30
-0.3% | Sale
$50,001 - $100,000 | 2/24/2023 | 1/31/2023 | -50.5%
 |
UNH UnitedHealth Group | $518.22
-0.4% | Sale
$15,001 - $50,000 | 2/24/2023 | 1/31/2023 | +3.8%
 |
INVH Invitation Homes | $33.07
+1.2% | Purchase
$1,001 - $15,000 | 2/24/2023 | 1/31/2023 | +1.8%
 |
MMM 3M | $92.90
-0.3% | Purchase
$1,001 - $15,000 | 2/24/2023 | 1/31/2023 | -19.3%
 |
ABBV AbbVie | $174.08
-0.4% | Purchase
$1,001 - $15,000 | 2/24/2023 | 1/31/2023 | +17.8%
 |
ATVI Activision Blizzard | $94.42
-0.1% | Sale
$1,001 - $15,000 | 2/24/2023 | 1/31/2023 | +23.3%
 |
LHX L3Harris Technologies | $209.84
+0.3% | Purchase
$15,001 - $50,000 | 2/24/2023 | 1/31/2023 | -2.3%
 |
LIN Linde | $419.42
+1.3% | Sale
$15,001 - $50,000 | 2/24/2023 | 1/31/2023 | +26.7%
 |
LMT Lockheed Martin | $426.50
-0.1% | Purchase
$15,001 - $50,000 | 2/24/2023 | 1/31/2023 | -7.9%
 |
ABNB Airbnb | $147.60
-2.0% | Purchase
$15,001 - $50,000 | 2/24/2023 | 1/31/2023 | +32.8%
 |
ALLY Ally Financial | $36.09
-0.3% | Purchase
$15,001 - $50,000 | 2/24/2023 | 1/31/2023 | +11.1%
 |
ALNY Alnylam Pharmaceuticals | $170.03
+0.3% | Sale
$15,001 - $50,000 | 2/24/2023 | 1/31/2023 | -24.9%
 |
LCID Lucid Group | $3.52
+0.3% | Purchase
$15,001 - $50,000 | 2/24/2023 | 1/31/2023 | -69.9%
 |
MTB M&T Bank | $133.33
+1.3% | Purchase
$15,001 - $50,000 | 2/24/2023 | 1/31/2023 | -14.5%
 |
MAXR Maxar Technologies | $52.99
| Sale
$1,001 - $15,000 | 2/24/2023 | 1/31/2023 | +2.6%
 |
MDT Medtronic | $84.99
-1.4% | Purchase
$15,001 - $50,000 | 2/24/2023 | 1/31/2023 | +1.6%
 |
MRK Merck & Co., Inc. | $125.45
-0.9% | Purchase
$1,001 - $15,000 | 2/24/2023 | 1/31/2023 | +16.8%
 |
MSFT Microsoft | $420.55
+1.6% | Sale
$50,001 - $100,000 | 2/24/2023 | 1/31/2023 | +69.7%
 |
MDLZ Mondelez International | $73.17
-2.1% | Purchase
$15,001 - $50,000 | 2/24/2023 | 1/31/2023 | +11.8%
 |
NEE NextEra Energy | $56.58
+0.5% | Sale
$50,001 - $100,000 | 2/24/2023 | 1/31/2023 | -24.2%
 |
NOC Northrop Grumman | $454.92
+0.8% | Sale
$15,001 - $50,000 | 2/24/2023 | 1/31/2023 | +1.5%
 |
PEP PepsiCo | $167.67
-3.6% | Sale
$15,001 - $50,000 | 2/24/2023 | 1/31/2023 | -2.0%
 |
GOOGL Alphabet | $149.00
+2.1% | Purchase
$50,001 - $100,000 | 2/24/2023 | 1/31/2023 | +50.7%
 |
MO Altria Group | $40.11
+0.0% | Purchase
$15,001 - $50,000 | 2/24/2023 | 1/31/2023 | -10.9%
 |
PLUG Plug Power | $4.33
+3.3% | Purchase
$15,001 - $50,000 | 2/24/2023 | 1/31/2023 | -74.6%
 |
PG Procter & Gamble | $157.42
-0.8% | Purchase
$50,001 - $100,000 | 2/24/2023 | 1/31/2023 | +10.6%
 |
PEG Public Service Enterprise Group | $58.42
+0.4% | Purchase
$1,001 - $15,000 | 2/24/2023 | 1/31/2023 | -5.7%
 |
RJF Raymond James | $114.88
+2.5% | Purchase
$15,001 - $50,000 | 2/24/2023 | 1/31/2023 | +1.9%
 |
RTX RTX | $90.51
-0.6% | Sale
$15,001 - $50,000 | 2/24/2023 | 1/31/2023 | -9.4%
 |
AMZN Amazon.com | $174.45
+2.7% | Sale
$50,001 - $100,000 | 2/24/2023 | 1/31/2023 | +69.2%
 |
AON AON | $312.56
+1.8% | Purchase
$15,001 - $50,000 | 2/24/2023 | 1/31/2023 | -1.9%
 |
AAPL Apple | $188.85
+0.3% | Sale
$15,001 - $50,000 | 2/24/2023 | 1/31/2023 | +30.9%
 |
APTV Aptiv | $82.02
+0.9% | Purchase
$15,001 - $50,000 | 2/24/2023 | 1/31/2023 | -27.5%
 |
ADM Archer-Daniels-Midland | $53.05
+0.7% | Sale
$15,001 - $50,000 | 2/24/2023 | 1/31/2023 | -36.0%
 |
ANET Arista Networks | $282.45
+2.4% | Purchase
$1,001 - $15,000 | 2/24/2023 | 1/31/2023 | +124.1%
 |
ARWR Arrowhead Pharmaceuticals | $32.56
+5.5% | Sale
$1,001 - $15,000 | 2/24/2023 | 1/31/2023 | -6.9%
 |
TEAM Atlassian | $218.76
+3.0% | Purchase
$1,001 - $15,000 | 2/24/2023 | 1/31/2023 | +35.4%
 |
ESALY Eisai | $61.51
-2.1% | Sale
$1,001 - $15,000 | 2/24/2023 | 1/30/2023 | |
RDSMY Koninklijke DSM | $33.85
+3.3% | Sale
$1,001 - $15,000 | 2/24/2023 | 1/24/2023 | |
MUNI PIMCO Intermediate Municipal Bond Exchange-Traded Fund | $52.41
+0.0% | Purchase
$100,001 - $250,000 | 2/24/2023 | 1/17/2023 | +0.2%
 |
UL Unilever | $50.61
-0.1% | Purchase
$15,001 - $50,000 | 2/24/2023 | 1/13/2023 | -1.6%
 |
AJINY Ajinomoto | $38.34
-0.2% | Purchase
$1,001 - $15,000 | 2/24/2023 | 1/13/2023 | +23.0%
 |
ZURVY Zurich Insurance Group | $49.33
-0.6% | Sale
$15,001 - $50,000 | 2/24/2023 | 1/13/2023 | +2.5%
 |
WJRYY West Japan Railway | $42.24
-0.1% | Purchase
$1,001 - $15,000 | 2/24/2023 | 1/13/2023 | +1.5%
 |
TOSYY Toshiba | $15.35
+0.3% | Purchase
$1,001 - $15,000 | 2/24/2023 | 1/13/2023 | -13.5%
 |
TRYIY Toray Industries | $9.04
-3.2% | Purchase
$1,001 - $15,000 | 2/24/2023 | 1/13/2023 | -19.6%
 |
BTI British American Tobacco | $30.75
-2.3% | Sale
$50,001 - $100,000 | 2/24/2023 | 1/13/2023 | -19.9%
 |
BAYRY Bayer Aktiengesellschaft | $7.53
| Purchase
$1,001 - $15,000 | 2/24/2023 | 1/13/2023 | -51.8%
 |
ALPMY Astellas Pharma | $10.79
+0.6% | Sale
$1,001 - $15,000 | 2/24/2023 | 1/13/2023 | -26.2%
 |
TKOMY Tokio Marine | $26.05
0.0% | Sale
$1,001 - $15,000 | 2/24/2023 | 1/13/2023 | +22.4%
 |
STBFY Suntory Beverage & Food | $16.56
+0.2% | Purchase
$1,001 - $15,000 | 2/24/2023 | 1/13/2023 | -0.4%
 |
SOMMY Sumitomo Chemical | $10.10
-0.1% | Purchase
$1,001 - $15,000 | 2/24/2023 | 1/13/2023 | -44.7%
 |
SMPNY Sompo | $26.42
+0.6% | Sale
$15,001 - $50,000 | 2/24/2023 | 1/13/2023 | +18.2%
 |
SSDOY Shiseido | $28.40
+4.0% | Purchase
$1,001 - $15,000 | 2/24/2023 | 1/13/2023 | -42.4%
 |
SVNDY Seven & i | $20.61
+1.9% | Purchase
$1,001 - $15,000 | 2/24/2023 | 1/13/2023 | -13.4%
 |
RHHBY Roche | $32.31
+0.7% | Purchase
$15,001 - $50,000 | 2/24/2023 | 1/13/2023 | -18.1%
 |
PSO Pearson | $12.01
+1.5% | Sale
$1,001 - $15,000 | 2/24/2023 | 1/13/2023 | +5.8%
 |
NICE NICE | $221.10
+1.3% | Sale
$1,001 - $15,000 | 2/24/2023 | 1/13/2023 | +11.1%
 |
MSADY MS&AD Insurance Group | $20.12
-0.4% | Purchase
$1,001 - $15,000 | 2/24/2023 | 1/13/2023 | +24.2%
 |
LOGI Logitech International | $85.21
+0.7% | Sale
$1,001 - $15,000 | 2/24/2023 | 1/13/2023 | +55.7%
 |
KNBWY Kirin | $14.42
+0.3% | Purchase
$1,001 - $15,000 | 2/24/2023 | 1/13/2023 | -3.1%
 |
KDDIY KDDI | $14.94
-0.5% | Purchase
$1,001 - $15,000 | 2/24/2023 | 1/13/2023 | -1.3%
 |
JAPSY Japan Airlines | $9.26
-1.0% | Sale
$1,001 - $15,000 | 2/24/2023 | 1/13/2023 | -7.5%
 |
IDEXY Industria de Diseño Textil | $21.14
+0.9% | Sale
$1,001 - $15,000 | 2/24/2023 | 1/13/2023 | +41.5%
 |
HTHIY Hitachi | $162.44
+1.1% | Sale
$1,001 - $15,000 | 2/24/2023 | 1/13/2023 | +61.7%
 |
HLN Haleon | $8.13
-1.7% | Purchase
$1,001 - $15,000 | 2/24/2023 | 1/13/2023 | +1.8%
 |
GVDNY Givaudan | $82.24
-1.1% | Sale
$1,001 - $15,000 | 2/24/2023 | 1/13/2023 | +27.5%
 |
FANUY Fanuc | $13.25
-0.5% | Purchase
$1,001 - $15,000 | 2/24/2023 | 1/13/2023 | -18.2%
 |
DEO Diageo | $146.48
-0.8% | Purchase
$15,001 - $50,000 | 2/24/2023 | 1/13/2023 | -20.0%
 |
MUNI PIMCO Intermediate Municipal Bond Exchange-Traded Fund | $52.41
+0.0% | Sale
$250,001 - $500,000 | 2/24/2023 | 1/10/2023 | +1.1%
 |