PARA Paramount Global | $12.90
-0.8% | Purchase
$15,001 - $50,000 | 1/12/2024 | 12/26/2023 | -14.1%
 |
KEY KeyCorp | $13.89
+0.1% | Purchase
$15,001 - $50,000 | 1/12/2024 | 12/26/2023 | -3.9%
 |
VZ Verizon Communications | $39.72
-0.5% | Sale (Partial)
$15,001 - $50,000 | 1/12/2024 | 12/26/2023 | +6.0%
 |
RF Regions Financial | $18.00
+0.6% | Sale (Full)
$15,001 - $50,000 | 1/12/2024 | 12/26/2023 | -8.0%
 |
UAA Under Armour | $8.09
+4.9% | Sale (Full)
$15,001 - $50,000 | 1/12/2024 | 12/19/2023 | -13.8%
 |
GOLD Barrick Gold | $14.67
-1.0% | Purchase
$50,001 - $100,000 | 1/12/2024 | 12/18/2023 | -17.3%
 |
CVX Chevron | $151.04
-2.0% | Sale (Full)
$1,001 - $15,000 | 1/12/2024 | 12/18/2023 | +0.9%
 |
GOLD Barrick Gold | $14.67
-1.0% | Sale (Full)
$15,001 - $50,000 | 1/12/2024 | 12/18/2023 | -17.3%
|
GOLD Barrick Gold | $14.67
-1.0% | Sale (Full)
$1,001 - $15,000 | 1/12/2024 | 12/18/2023 | -17.3%
|
CVX Chevron | $151.04
-2.0% | Purchase
$50,001 - $100,000 | 1/12/2024 | 12/14/2023 | +0.8%
 |
CVX Chevron | $151.04
-2.0% | Purchase
$100,001 - $250,000 | 1/12/2024 | 12/13/2023 | +4.4%
 |
DVA DaVita | $109.86
-0.9% | Sale (Full)
$1,001 - $15,000 | 1/12/2024 | 12/12/2023 | +1.3%
 |
GOLD Barrick Gold | $14.67
-1.0% | Purchase
$15,001 - $50,000 | 1/12/2024 | 12/12/2023 | -10.2%
 |
GOLD Barrick Gold | $14.67
-1.0% | Purchase
$1,001 - $15,000 | 1/12/2024 | 12/11/2023 | -11.9%
 |
MDLZ Mondelez International | $73.17
-2.1% | Purchase
$1,001 - $15,000 | 12/15/2023 | 11/22/2023 | +2.3%
 |
KEY KeyCorp | $13.89
+0.1% | Purchase
$15,001 - $50,000 | 12/15/2023 | 11/21/2023 | +15.7%
 |
CLF Cleveland-Cliffs | $19.87
+2.8% | Sale (Full)
$1,001 - $15,000 | 12/15/2023 | 11/21/2023 | +17.6%
 |
FGBI First Guaranty Bancshares | $11.31
+1.6% | Sale (Full)
$15,001 - $50,000 | 12/15/2023 | 11/21/2023 | +18.9%
 |
ABBV AbbVie | $174.08
-0.4% | Sale (Full)
$1,001 - $15,000 | 12/15/2023 | 11/20/2023 | +25.9%
 |
BMY Bristol-Myers Squibb | $49.81
+2.3% | Sale (Full)
$1,001 - $15,000 | 12/15/2023 | 11/16/2023 | -2.0%
 |
MCHP Microchip Technology | $85.44
+1.3% | Sale (Full)
$1,001 - $15,000 | 12/15/2023 | 11/15/2023 | +3.6%
 |
AMAT Applied Materials | $185.84
+6.9% | Sale (Full)
$1,001 - $15,000 | 12/15/2023 | 11/15/2023 | +19.6%
 |
OXY Occidental Petroleum | $57.47
-1.0% | Sale (Full)
$1,001 - $15,000 | 12/15/2023 | 11/14/2023 | -6.9%
 |
CLF Cleveland-Cliffs | $19.87
+2.8% | Sale (Full)
$1,001 - $15,000 | 12/15/2023 | 11/9/2023 | +20.9%
 |
MSFT Microsoft | $420.55
+1.6% | Sale (Full)
$1,001 - $15,000 | 12/15/2023 | 11/9/2023 | +16.6%
 |
X United States Steel | $46.29
-0.2% | Purchase
$1,001 - $15,000 | 12/15/2023 | 11/7/2023 | +35.4%
 |
CLX Clorox | $153.20
-0.7% | Sale (Partial)
$15,001 - $50,000 | 11/16/2023 | 10/31/2023 | +30.2%
 |
KMB Kimberly-Clark | $119.81
-0.4% | Sale (Full)
$1,001 - $15,000 | 11/16/2023 | 10/31/2023 | +0.1%
 |
KMB Kimberly-Clark | $119.81
-0.4% | Sale (Full)
$100,001 - $250,000 | 11/16/2023 | 10/31/2023 | +0.1%
|
HPQ HP | $28.42
+0.5% | Sale (Full)
$15,001 - $50,000 | 11/16/2023 | 10/31/2023 | +7.9%
 |
CLX Clorox | $153.20
-0.7% | Sale (Full)
$50,001 - $100,000 | 11/16/2023 | 10/31/2023 | +30.2%
|
CLF Cleveland-Cliffs | $19.87
+2.8% | Sale (Full)
$1,001 - $15,000 | 11/16/2023 | 10/31/2023 | +18.4%
 |
CLX Clorox | $153.20
-0.7% | Sale (Partial)
$100,001 - $250,000 | 11/16/2023 | 10/31/2023 | +30.2%
|
CLX Clorox | $153.20
-0.7% | Sale (Partial)
$1,001 - $15,000 | 11/16/2023 | 10/31/2023 | +30.2%
|
HPQ HP | $28.42
+0.5% | Purchase
$15,001 - $50,000 | 11/16/2023 | 10/30/2023 | +8.6%
 |
CLX Clorox | $153.20
-0.7% | Purchase
$100,001 - $250,000 | 11/16/2023 | 10/25/2023 | +25.6%
 |
HPQ HP | $28.42
+0.5% | Purchase
$15,001 - $50,000 | 11/16/2023 | 10/23/2023 | +9.8%
 |
HPQ HP | $28.42
+0.5% | Sale (Full)
$15,001 - $50,000 | 11/16/2023 | 10/23/2023 | +9.8%
|
CLF Cleveland-Cliffs | $19.87
+2.8% | Purchase
$15,001 - $50,000 | 11/16/2023 | 10/23/2023 | +38.3%
 |
CLF Cleveland-Cliffs | $19.87
+2.8% | Purchase
$15,001 - $50,000 | 11/16/2023 | 10/18/2023 | +38.1%
 |
TXN Texas Instruments | $162.40
+1.4% | Purchase
$1,001 - $15,000 | 11/16/2023 | 10/17/2023 | +5.3%
 |
TSLA Tesla | $193.57
+2.1% | Purchase
$1,001 - $15,000 | 11/16/2023 | 10/17/2023 | -24.0%
 |
MNST Monster Beverage | $55.66
-1.5% | Purchase
$1,001 - $15,000 | 11/16/2023 | 10/17/2023 | +11.8%
 |
MPWR Monolithic Power Systems | $752.31
+2.1% | Purchase
$1,001 - $15,000 | 11/16/2023 | 10/17/2023 | +57.9%
 |
PHM PulteGroup | $103.10
-0.2% | Purchase
$1,001 - $15,000 | 11/16/2023 | 10/17/2023 | +40.3%
 |
TSLA Tesla | $193.57
+2.1% | Sale (Full)
$1,001 - $15,000 | 11/16/2023 | 10/17/2023 | -24.0%
|
ABBV AbbVie | $174.08
-0.4% | Purchase
$1,001 - $15,000 | 11/16/2023 | 10/17/2023 | +16.7%
 |
MCO Moody's | $405.17
+1.8% | Purchase
$1,001 - $15,000 | 11/16/2023 | 10/17/2023 | +26.1%
 |
GGG Graco | $88.16
+0.4% | Purchase
$1,001 - $15,000 | 11/16/2023 | 10/17/2023 | +17.9%
 |
AMAT Applied Materials | $185.84
+6.9% | Purchase
$1,001 - $15,000 | 11/16/2023 | 10/17/2023 | +30.2%
 |
META Meta Platforms | $468.11
-0.4% | Purchase
$1,001 - $15,000 | 11/16/2023 | 10/17/2023 | +44.5%
 |
BMY Bristol-Myers Squibb | $49.81
+2.3% | Purchase
$1,001 - $15,000 | 11/16/2023 | 10/17/2023 | -13.2%
 |
AMAT Applied Materials | $185.84
+6.9% | Sale (Full)
$1,001 - $15,000 | 11/16/2023 | 10/17/2023 | +30.2%
|
NXPI NXP Semiconductors | $233.55
+2.5% | Purchase
$1,001 - $15,000 | 11/16/2023 | 10/17/2023 | +18.1%
 |
WMS Advanced Drainage Systems | $162.04
+2.6% | Purchase
$1,001 - $15,000 | 11/16/2023 | 10/17/2023 | +37.1%
 |
KO Coca-Cola | $59.56
-0.5% | Purchase
$1,001 - $15,000 | 11/16/2023 | 10/17/2023 | +10.2%
 |
MMM 3M | $92.90
-0.3% | Purchase
$15,001 - $50,000 | 11/16/2023 | 10/17/2023 | +2.6%
 |
KO Coca-Cola | $59.56
-0.5% | Sale (Full)
$1,001 - $15,000 | 11/16/2023 | 10/17/2023 | +10.2%
|
SWKS Skyworks Solutions | $105.05
+0.4% | Sale (Full)
$1,001 - $15,000 | 11/16/2023 | 10/17/2023 | +9.8%
 |
MMC Marsh & McLennan Companies | $197.91
+0.6% | Purchase
$1,001 - $15,000 | 11/16/2023 | 10/17/2023 | +3.7%
 |
WU Western Union | $12.47
+3.2% | Purchase
$1,001 - $15,000 | 11/16/2023 | 10/17/2023 | -6.8%
 |
ROK Rockwell Automation | $283.50
+1.7% | Purchase
$1,001 - $15,000 | 11/16/2023 | 10/17/2023 | -2.4%
 |
RMD ResMed | $184.63
+0.5% | Purchase
$1,001 - $15,000 | 11/16/2023 | 10/17/2023 | +30.2%
 |
AON AON | $312.56
+1.8% | Purchase
$1,001 - $15,000 | 11/16/2023 | 10/17/2023 | -4.6%
 |
SCCO Southern Copper | $80.16
-1.0% | Purchase
$1,001 - $15,000 | 11/16/2023 | 10/17/2023 | +8.6%
 |
MCHP Microchip Technology | $85.44
+1.3% | Purchase
$1,001 - $15,000 | 11/16/2023 | 10/17/2023 | +8.3%
 |
FTNT Fortinet | $70.44
+3.8% | Purchase
$1,001 - $15,000 | 11/16/2023 | 10/17/2023 | +20.1%
 |
UNP Union Pacific | $249.45
+0.3% | Sale (Full)
$1,001 - $15,000 | 11/16/2023 | 10/17/2023 | +18.0%
 |
TXN Texas Instruments | $162.40
+1.4% | Purchase
$15,001 - $50,000 | 11/16/2023 | 10/17/2023 | +5.3%
|
ITW Illinois Tool Works | $255.75
+0.5% | Purchase
$1,001 - $15,000 | 11/16/2023 | 10/17/2023 | +8.7%
 |
DIOD Diodes | $69.99
+1.8% | Sale (Full)
$1,001 - $15,000 | 11/16/2023 | 10/16/2023 | -10.9%
 |
CBSH Commerce Bancshares | $51.16
+1.4% | Sale (Full)
$1,001 - $15,000 | 11/16/2023 | 10/16/2023 | +5.9%
 |
GIS General Mills | $62.34
-2.7% | Sale (Full)
$1,001 - $15,000 | 11/16/2023 | 10/16/2023 | -1.4%
 |
SKY Skyline Champion | $81.17
+2.1% | Sale (Full)
$1,001 - $15,000 | 11/16/2023 | 10/16/2023 | +31.7%
 |
CSX CSX | $36.89
-0.5% | Sale (Partial)
$1,001 - $15,000 | 11/16/2023 | 10/16/2023 | +17.4%
 |
RRC Range Resources | $27.99
-1.7% | Sale (Full)
$1,001 - $15,000 | 11/16/2023 | 10/16/2023 | -20.2%
 |
ODFL Old Dominion Freight Line | $435.33
+0.0% | Sale (Full)
$1,001 - $15,000 | 11/16/2023 | 10/16/2023 | +5.6%
 |
NSC Norfolk Southern | $254.83
+0.3% | Sale (Full)
$1,001 - $15,000 | 11/16/2023 | 10/16/2023 | +22.8%
 |
A Agilent Technologies | $133.34
-0.5% | Sale (Partial)
$1,001 - $15,000 | 11/16/2023 | 10/16/2023 | +19.7%
 |
CRUS Cirrus Logic | $93.06
-0.2% | Sale (Full)
$1,001 - $15,000 | 11/16/2023 | 10/16/2023 | +30.8%
 |
GSK GSK | $41.91
+0.2% | Sale (Full)
$1,001 - $15,000 | 11/16/2023 | 10/16/2023 | +14.6%
 |
JKHY Jack Henry & Associates | $175.93
+1.1% | Sale (Full)
$1,001 - $15,000 | 11/16/2023 | 10/16/2023 | +19.0%
 |
JNJ Johnson & Johnson | $156.76
+0.2% | Sale (Full)
$1,001 - $15,000 | 11/16/2023 | 10/16/2023 | -0.4%
 |
MRK Merck & Co., Inc. | $125.45
-0.9% | Sale (Full)
$1,001 - $15,000 | 11/16/2023 | 10/16/2023 | +20.5%
 |
ADP Automatic Data Processing | $249.99
-0.4% | Sale (Full)
$1,001 - $15,000 | 11/16/2023 | 10/16/2023 | +0.3%
 |
NU NU | $9.89
+2.6% | Sale (Full)
$100,001 - $250,000 | 11/16/2023 | 10/11/2023 | +26.1%
 |
TXN Texas Instruments | $162.40
+1.4% | Sale (Partial)
$50,001 - $100,000 | 11/16/2023 | 10/11/2023 | +3.2%
 |
LPX Louisiana-Pacific | $69.57
+0.7% | Sale (Full)
$100,001 - $250,000 | 11/16/2023 | 10/11/2023 | +28.4%
 |
KR Kroger | $45.41
-0.1% | Sale (Full)
$50,001 - $100,000 | 11/16/2023 | 10/11/2023 | +2.8%
 |
TXN Texas Instruments | $162.40
+1.4% | Sale (Partial)
$15,001 - $50,000 | 11/16/2023 | 10/11/2023 | +3.2%
|
X United States Steel | $46.29
-0.2% | Sale (Partial)
$15,001 - $50,000 | 11/16/2023 | 10/11/2023 | +38.1%
 |
TXN Texas Instruments | $162.40
+1.4% | Sale (Partial)
$1,001 - $15,000 | 11/16/2023 | 10/11/2023 | +3.2%
|
TXN Texas Instruments | $162.40
+1.4% | Sale (Full)
$15,001 - $50,000 | 11/16/2023 | 10/11/2023 | +3.2%
|
X United States Steel | $46.29
-0.2% | Sale (Partial)
$1,001 - $15,000 | 11/16/2023 | 10/11/2023 | +38.1%
|
X United States Steel | $46.29
-0.2% | Purchase
$1,001 - $15,000 | 11/16/2023 | 10/11/2023 | +38.1%
|
TXN Texas Instruments | $162.40
+1.4% | Purchase
$1,001 - $15,000 | 11/16/2023 | 10/11/2023 | +3.2%
|
LPX Louisiana-Pacific | $69.57
+0.7% | Purchase
$1,001 - $15,000 | 11/16/2023 | 10/11/2023 | +28.4%
|
LPX Louisiana-Pacific | $69.57
+0.7% | Sale (Full)
$1,001 - $15,000 | 11/16/2023 | 10/11/2023 | +28.4%
|
KR Kroger | $45.41
-0.1% | Purchase
$50,001 - $100,000 | 11/16/2023 | 10/3/2023 | +2.6%
 |
KR Kroger | $45.41
-0.1% | Purchase
$15,001 - $50,000 | 10/13/2023 | 9/28/2023 | +0.7%
 |
CLX Clorox | $153.20
-0.7% | Purchase
$100,001 - $250,000 | 10/13/2023 | 9/20/2023 | +12.3%
 |
PARA Paramount Global | $12.90
-0.8% | Purchase
$50,001 - $100,000 | 10/13/2023 | 9/18/2023 | -5.1%
 |
FITB Fifth Third Bancorp | $33.65
+0.8% | Sale (Full)
$1,001 - $15,000 | 10/13/2023 | 9/18/2023 | +24.0%
 |
TXN Texas Instruments | $162.40
+1.4% | Purchase
$100,001 - $250,000 | 10/13/2023 | 9/18/2023 | -0.3%
 |
LPX Louisiana-Pacific | $69.57
+0.7% | Sale (Full)
$1,001 - $15,000 | 10/13/2023 | 9/18/2023 | +19.9%
 |
PARA Paramount Global | $12.90
-0.8% | Sale (Full)
$1,001 - $15,000 | 10/13/2023 | 9/18/2023 | -5.1%
|
TXN Texas Instruments | $162.40
+1.4% | Sale (Full)
$1,001 - $15,000 | 10/13/2023 | 9/18/2023 | -0.3%
|
KMB Kimberly-Clark | $119.81
-0.4% | Purchase
$15,001 - $50,000 | 10/13/2023 | 9/15/2023 | -4.2%
 |
CLF Cleveland-Cliffs | $19.87
+2.8% | Purchase
$1,001 - $15,000 | 10/13/2023 | 9/14/2023 | +35.8%
 |
TXN Texas Instruments | $162.40
+1.4% | Purchase
$50,001 - $100,000 | 10/13/2023 | 9/14/2023 | -2.2%
 |
INTC Intel | $43.31
+1.9% | Sale (Full)
$1,001 - $15,000 | 10/13/2023 | 9/13/2023 | +11.9%
 |
QCOM QUALCOMM | $151.00
+1.9% | Sale (Full)
$250,001 - $500,000 | 10/13/2023 | 9/13/2023 | +34.1%
 |
QCOM QUALCOMM | $151.00
+1.9% | Sale (Full)
$15,001 - $50,000 | 10/13/2023 | 9/13/2023 | +34.1%
|
QCOM QUALCOMM | $151.00
+1.9% | Purchase
$1,001 - $15,000 | 10/13/2023 | 9/13/2023 | +34.1%
|
KMB Kimberly-Clark | $119.81
-0.4% | Purchase
$50,001 - $100,000 | 10/13/2023 | 9/13/2023 | -4.1%
 |
LPX Louisiana-Pacific | $69.57
+0.7% | Purchase
$100,001 - $250,000 | 10/13/2023 | 9/12/2023 | +16.7%
 |
KMB Kimberly-Clark | $119.81
-0.4% | Purchase
$15,001 - $50,000 | 10/13/2023 | 9/8/2023 | -6.0%
 |
LLY Eli Lilly and Company | $740.16
+0.6% | Sale (Partial)
$1,001 - $15,000 | 10/13/2023 | 9/8/2023 | +26.2%
 |
CLF Cleveland-Cliffs | $19.87
+2.8% | Purchase
$50,001 - $100,000 | 10/13/2023 | 9/8/2023 | +39.4%
 |
AAPL Apple | $188.85
+0.3% | Sale (Partial)
$15,001 - $50,000 | 10/13/2023 | 9/7/2023 | +6.4%
 |
PRU Prudential Financial | $105.58
-2.8% | Sale (Partial)
$15,001 - $50,000 | 10/13/2023 | 9/7/2023 | +12.0%
 |
CLF Cleveland-Cliffs | $19.87
+2.8% | Purchase
$50,001 - $100,000 | 10/13/2023 | 9/7/2023 | +37.7%
 |
TSN Tyson Foods | $52.58
-2.6% | Sale (Partial)
$1,001 - $15,000 | 10/13/2023 | 9/7/2023 | +2.4%
 |
QCOM QUALCOMM | $151.00
+1.9% | Sale (Full)
$1,001 - $15,000 | 10/13/2023 | 9/1/2023 | +30.9%
 |
QCOM QUALCOMM | $151.00
+1.9% | Purchase
$100,001 - $250,000 | 9/15/2023 | 8/31/2023 | +31.8%
 |
INTC Intel | $43.31
+1.9% | Purchase
$1,001 - $15,000 | 9/15/2023 | 8/18/2023 | +32.2%
 |
F Ford Motor | $12.68
-1.2% | Sale (Full)
$100,001 - $250,000 | 9/15/2023 | 8/14/2023 | +3.9%
 |
F Ford Motor | $12.68
-1.2% | Purchase
$1,001 - $15,000 | 9/15/2023 | 8/14/2023 | +3.9%
|
CCL Carnival Co. & | $15.31
-2.4% | Sale (Full)
$1,001 - $15,000 | 8/14/2023 | 7/27/2023 | -16.0%
 |
PFE Pfizer | $27.56
0.0% | Purchase
$1,001 - $15,000 | 8/14/2023 | 7/25/2023 | -25.6%
 |
WBA Walgreens Boots Alliance | $22.24
-1.3% | Purchase
$1,001 - $15,000 | 8/14/2023 | 7/25/2023 | -27.5%
 |
UAA Under Armour | $8.09
+4.9% | Purchase
$1,001 - $15,000 | 8/14/2023 | 7/25/2023 | +2.8%
 |
CLF Cleveland-Cliffs | $19.87
+2.8% | Sale (Full)
$1,001 - $15,000 | 8/14/2023 | 7/25/2023 | +13.0%
 |
FGBI First Guaranty Bancshares | $11.31
+1.6% | Purchase
$1,001 - $15,000 | 8/14/2023 | 7/25/2023 | -9.8%
 |
HUMA Humacyte | $3.63
+16.0% | Purchase
$1,001 - $15,000 | 8/14/2023 | 7/25/2023 | +26.5%
 |
MMM 3M | $92.90
-0.3% | Purchase
$1,001 - $15,000 | 8/14/2023 | 7/25/2023 | -15.4%
 |
KEY KeyCorp | $13.89
+0.1% | Purchase
$1,001 - $15,000 | 8/14/2023 | 7/25/2023 | +19.5%
 |
VZ Verizon Communications | $39.72
-0.5% | Purchase
$1,001 - $15,000 | 8/14/2023 | 7/25/2023 | +16.0%
 |
PG Procter & Gamble | $157.42
-0.8% | Sale (Full)
$1,001 - $15,000 | 8/14/2023 | 7/24/2023 | +2.6%
 |
CLF Cleveland-Cliffs | $19.87
+2.8% | Purchase
$50,001 - $100,000 | 8/14/2023 | 7/24/2023 | +20.4%
 |
TXN Texas Instruments | $162.40
+1.4% | Sale (Full)
$1,001 - $15,000 | 8/14/2023 | 7/19/2023 | -11.6%
 |
LPX Louisiana-Pacific | $69.57
+0.7% | Sale (Full)
$1,001 - $15,000 | 8/14/2023 | 7/13/2023 | -11.3%
 |
CLF Cleveland-Cliffs | $19.87
+2.8% | Sale (Partial)
$1,001 - $15,000 | 7/14/2023 | 6/29/2023 | +17.6%
 |
X United States Steel | $46.29
-0.2% | Sale (Full)
$50,001 - $100,000 | 7/14/2023 | 6/20/2023 | +97.2%
 |
CLF Cleveland-Cliffs | $19.87
+2.8% | Purchase
$15,001 - $50,000 | 7/14/2023 | 6/20/2023 | +20.9%
 |
MSFT Microsoft | $420.55
+1.6% | Sale (Full)
$250,001 - $500,000 | 7/14/2023 | 6/20/2023 | +24.4%
 |
X United States Steel | $46.29
-0.2% | Sale (Partial)
$1,001 - $15,000 | 7/14/2023 | 6/14/2023 | +96.5%
 |
X United States Steel | $46.29
-0.2% | Sale (Partial)
$15,001 - $50,000 | 7/14/2023 | 6/14/2023 | +96.5%
|
TSLA Tesla | $193.57
+2.1% | Sale (Partial)
$1,001 - $15,000 | 7/14/2023 | 6/13/2023 | -25.2%
 |
UAA Under Armour | $8.09
+4.9% | Purchase
$1,001 - $15,000 | 7/14/2023 | 6/13/2023 | +6.6%
 |
WBA Walgreens Boots Alliance | $22.24
-1.3% | Purchase
$15,001 - $50,000 | 7/14/2023 | 6/13/2023 | -30.4%
 |
CCL Carnival Co. & | $15.31
-2.4% | Sale (Partial)
$1,001 - $15,000 | 7/14/2023 | 6/13/2023 | -0.2%
 |
CCL Carnival Co. & | $15.31
-2.4% | Sale (Partial)
$1,001 - $15,000 | 7/14/2023 | 6/13/2023 | -0.2%
|
PFE Pfizer | $27.56
0.0% | Purchase
$1,001 - $15,000 | 7/14/2023 | 6/12/2023 | -30.9%
 |
FGBI First Guaranty Bancshares | $11.31
+1.6% | Purchase
$1,001 - $15,000 | 7/14/2023 | 6/12/2023 | -20.2%
 |
FGBI First Guaranty Bancshares | $11.31
+1.6% | Purchase
$1,001 - $15,000 | 7/14/2023 | 6/12/2023 | -20.2%
|
KEY KeyCorp | $13.89
+0.1% | Purchase
$1,001 - $15,000 | 7/14/2023 | 6/12/2023 | +35.9%
 |
WBA Walgreens Boots Alliance | $22.24
-1.3% | Purchase
$1,001 - $15,000 | 7/14/2023 | 6/12/2023 | -29.7%
 |
CVX Chevron | $151.04
-2.0% | Purchase
$1,001 - $15,000 | 7/14/2023 | 6/12/2023 | -4.0%
 |
CFG Citizens Financial Group | $31.50
+0.4% | Purchase
$1,001 - $15,000 | 7/14/2023 | 6/12/2023 | +14.9%
 |
DVA DaVita | $109.86
-0.9% | Sale (Partial)
$1,001 - $15,000 | 7/14/2023 | 6/12/2023 | +13.2%
 |
FITB Fifth Third Bancorp | $33.65
+0.8% | Purchase
$1,001 - $15,000 | 7/14/2023 | 6/12/2023 | +29.8%
 |
COF Capital One Financial | $135.17
-0.2% | Sale (Partial)
$1,001 - $15,000 | 7/14/2023 | 6/9/2023 | +21.2%
 |
QCOM QUALCOMM | $151.00
+1.9% | Purchase
$1,001 - $15,000 | 7/14/2023 | 6/8/2023 | +29.8%
 |
X United States Steel | $46.29
-0.2% | Sale (Partial)
$1,001 - $15,000 | 7/14/2023 | 6/8/2023 | +103.6%
 |
QCOM QUALCOMM | $151.00
+1.9% | Purchase
$50,001 - $100,000 | 7/14/2023 | 6/6/2023 | +29.8%
 |
CVX Chevron | $151.04
-2.0% | Sale (Partial)
$1,001 - $15,000 | 7/14/2023 | 6/5/2023 | -2.9%
 |
QCOM QUALCOMM | $151.00
+1.9% | Sale (Partial)
$1,001 - $15,000 | 7/14/2023 | 6/5/2023 | +33.9%
 |
QCOM QUALCOMM | $151.00
+1.9% | Purchase
$100,001 - $250,000 | 7/14/2023 | 6/2/2023 | +30.6%
 |
CLF Cleveland-Cliffs | $19.87
+2.8% | Purchase
$15,001 - $50,000 | 7/14/2023 | 6/1/2023 | +41.1%
 |
QCOM QUALCOMM | $151.00
+1.9% | Purchase
$100,001 - $250,000 | 7/14/2023 | 6/1/2023 | +30.4%
 |
CLF Cleveland-Cliffs | $19.87
+2.8% | Sale (Partial)
$1,001 - $15,000 | 6/15/2023 | 5/25/2023 | +39.0%
 |
CLF Cleveland-Cliffs | $19.87
+2.8% | Purchase
$15,001 - $50,000 | 6/15/2023 | 5/25/2023 | +39.0%
|
CLF Cleveland-Cliffs | $19.87
+2.8% | Sale (Partial)
$1,001 - $15,000 | 6/15/2023 | 5/25/2023 | +39.0%
|
CLF Cleveland-Cliffs | $19.87
+2.8% | Sale (Partial)
$1,001 - $15,000 | 6/15/2023 | 5/25/2023 | +39.0%
|
CLF Cleveland-Cliffs | $19.87
+2.8% | Purchase
$1,001 - $15,000 | 6/15/2023 | 5/24/2023 | +40.0%
 |
V Visa | $276.43
+0.2% | Purchase
$1,001 - $15,000 | 6/15/2023 | 5/24/2023 | +24.4%
 |
V Visa | $276.43
+0.2% | Purchase
$1,001 - $15,000 | 6/15/2023 | 5/24/2023 | +24.4%
|
PYPL PayPal | $58.91
+5.0% | Sale (Partial)
$1,001 - $15,000 | 6/15/2023 | 5/23/2023 | -5.0%
 |
PYPL PayPal | $58.91
+5.0% | Sale (Partial)
$100,001 - $250,000 | 6/15/2023 | 5/23/2023 | -5.0%
|
PYPL PayPal | $58.91
+5.0% | Sale (Partial)
$50,001 - $100,000 | 6/15/2023 | 5/23/2023 | -5.0%
|
PYPL PayPal | $58.91
+5.0% | Sale (Partial)
$15,001 - $50,000 | 6/15/2023 | 5/23/2023 | -5.0%
|
PYPL PayPal | $58.91
+5.0% | Sale (Partial)
$15,001 - $50,000 | 6/15/2023 | 5/23/2023 | -5.0%
|
OXY Occidental Petroleum | $57.47
-1.0% | Purchase
$15,001 - $50,000 | 6/15/2023 | 5/22/2023 | -2.7%
 |
OXY Occidental Petroleum | $57.47
-1.0% | Sale (Partial)
$1,001 - $15,000 | 6/15/2023 | 5/22/2023 | -2.7%
|
OXY Occidental Petroleum | $57.47
-1.0% | Sale (Partial)
$1,001 - $15,000 | 6/15/2023 | 5/19/2023 | -2.8%
 |
X United States Steel | $46.29
-0.2% | Sale (Partial)
$1,001 - $15,000 | 6/15/2023 | 5/19/2023 | +112.1%
 |
AAPL Apple | $188.85
+0.3% | Sale (Partial)
$1,001 - $15,000 | 6/15/2023 | 5/19/2023 | +7.8%
 |
OXY Occidental Petroleum | $57.47
-1.0% | Sale (Partial)
$1,001 - $15,000 | 6/15/2023 | 5/19/2023 | -2.8%
|
CLF Cleveland-Cliffs | $19.87
+2.8% | Sale (Partial)
$1,001 - $15,000 | 6/15/2023 | 5/18/2023 | +29.3%
 |
CLX Clorox | $153.20
-0.7% | Sale (Partial)
$1,001 - $15,000 | 6/15/2023 | 5/17/2023 | -8.3%
 |
CLF Cleveland-Cliffs | $19.87
+2.8% | Sale (Partial)
$1,001 - $15,000 | 6/15/2023 | 5/17/2023 | +30.5%
 |
CLF Cleveland-Cliffs | $19.87
+2.8% | Sale (Partial)
$1,001 - $15,000 | 6/15/2023 | 5/17/2023 | +30.5%
|
F Ford Motor | $12.68
-1.2% | Sale (Partial)
$1,001 - $15,000 | 6/15/2023 | 5/17/2023 | +10.3%
 |
CLX Clorox | $153.20
-0.7% | Sale (Partial)
$1,001 - $15,000 | 6/15/2023 | 5/17/2023 | -8.3%
|
PYPL PayPal | $58.91
+5.0% | Purchase
$250,001 - $500,000 | 6/15/2023 | 5/11/2023 | -8.2%
 |
PYPL PayPal | $58.91
+5.0% | Purchase
$250,001 - $500,000 | 6/15/2023 | 5/10/2023 | -7.1%
 |
PG Procter & Gamble | $157.42
-0.8% | Sale (Partial)
$1,001 - $15,000 | 6/15/2023 | 5/8/2023 | +1.4%
 |
PG Procter & Gamble | $157.42
-0.8% | Sale (Partial)
$1,001 - $15,000 | 6/15/2023 | 5/8/2023 | +1.4%
|
PG Procter & Gamble | $157.42
-0.8% | Sale (Partial)
$1,001 - $15,000 | 6/15/2023 | 5/8/2023 | +1.4%
|
QCOM QUALCOMM | $151.00
+1.9% | Purchase
$1,001 - $15,000 | 6/15/2023 | 5/8/2023 | +39.4%
 |
RF Regions Financial | $18.00
+0.6% | Purchase
$1,001 - $15,000 | 6/15/2023 | 5/8/2023 | +9.8%
 |
X United States Steel | $46.29
-0.2% | Sale (Partial)
$1,001 - $15,000 | 6/15/2023 | 5/8/2023 | +114.4%
 |
WBA Walgreens Boots Alliance | $22.24
-1.3% | Purchase
$1,001 - $15,000 | 6/15/2023 | 5/8/2023 | -29.8%
 |
CLX Clorox | $153.20
-0.7% | Sale (Partial)
$1,001 - $15,000 | 6/15/2023 | 5/8/2023 | -8.4%
 |
CLX Clorox | $153.20
-0.7% | Sale (Partial)
$1,001 - $15,000 | 6/15/2023 | 5/8/2023 | -8.4%
|
CFG Citizens Financial Group | $31.50
+0.4% | Purchase
$1,001 - $15,000 | 6/15/2023 | 5/8/2023 | +22.3%
 |
GOLD Barrick Gold | $14.67
-1.0% | Sale (Partial)
$1,001 - $15,000 | 6/15/2023 | 5/8/2023 | +1530.0%
 |
GOLD Barrick Gold | $14.67
-1.0% | Sale (Partial)
$1,001 - $15,000 | 6/15/2023 | 5/8/2023 | +1530.0%
|
NU NU | $9.89
+2.6% | Purchase
$15,001 - $50,000 | 6/15/2023 | 5/8/2023 | +67.1%
 |
KEY KeyCorp | $13.89
+0.1% | Purchase
$1,001 - $15,000 | 6/15/2023 | 5/8/2023 | +43.5%
 |
FGBI First Guaranty Bancshares | $11.31
+1.6% | Purchase
$1,001 - $15,000 | 6/15/2023 | 5/8/2023 | -7.7%
 |
FITB Fifth Third Bancorp | $33.65
+0.8% | Purchase
$1,001 - $15,000 | 6/15/2023 | 5/8/2023 | +37.9%
 |
F Ford Motor | $12.68
-1.2% | Purchase
$15,001 - $50,000 | 5/11/2023 | 4/28/2023 | +6.7%
 |
CLF Cleveland-Cliffs | $19.87
+2.8% | Sale (Partial)
$1,001 - $15,000 | 5/11/2023 | 4/28/2023 | +29.2%
 |
CLF Cleveland-Cliffs | $19.87
+2.8% | Sale (Partial)
$1,001 - $15,000 | 5/11/2023 | 4/28/2023 | +29.2%
|
CLF Cleveland-Cliffs | $19.87
+2.8% | Sale (Partial)
$1,001 - $15,000 | 5/11/2023 | 4/28/2023 | +29.2%
|
CLF Cleveland-Cliffs | $19.87
+2.8% | Sale (Partial)
$1,001 - $15,000 | 5/11/2023 | 4/28/2023 | +29.2%
|
CLF Cleveland-Cliffs | $19.87
+2.8% | Sale (Partial)
$1,001 - $15,000 | 5/11/2023 | 4/28/2023 | +29.2%
|
F Ford Motor | $12.68
-1.2% | Purchase
$100,001 - $250,000 | 5/11/2023 | 4/27/2023 | +9.2%
 |
F Ford Motor | $12.68
-1.2% | Purchase
$15,001 - $50,000 | 5/11/2023 | 4/26/2023 | +9.9%
 |
ATVI Activision Blizzard | $94.42
-0.1% | Sale (Full)
$100,001 - $250,000 | 5/11/2023 | 4/26/2023 | +22.9%
 |
CLF Cleveland-Cliffs | $19.87
+2.8% | Sale (Partial)
$1,001 - $15,000 | 5/11/2023 | 4/24/2023 | +22.6%
 |
CLF Cleveland-Cliffs | $19.87
+2.8% | Purchase
$15,001 - $50,000 | 5/11/2023 | 4/24/2023 | +22.6%
|
X United States Steel | $46.29
-0.2% | Sale (Partial)
$100,001 - $250,000 | 5/11/2023 | 4/24/2023 | +83.5%
 |
X United States Steel | $46.29
-0.2% | Sale (Partial)
$50,001 - $100,000 | 5/11/2023 | 4/24/2023 | +83.5%
|
CLF Cleveland-Cliffs | $19.87
+2.8% | Sale (Partial)
$1,001 - $15,000 | 5/11/2023 | 4/24/2023 | +22.6%
|
CLF Cleveland-Cliffs | $19.87
+2.8% | Sale (Partial)
$1,001 - $15,000 | 5/11/2023 | 4/24/2023 | +22.6%
|
OXY Occidental Petroleum | $57.47
-1.0% | Sale (Partial)
$1,001 - $15,000 | 5/11/2023 | 4/18/2023 | -8.8%
 |
MMM 3M | $92.90
-0.3% | Purchase
$1,001 - $15,000 | 5/11/2023 | 4/14/2023 | -12.2%
 |
MRO Marathon Oil | $22.45
-1.1% | Sale (Partial)
$1,001 - $15,000 | 5/11/2023 | 4/14/2023 | -12.7%
 |
KMB Kimberly-Clark | $119.81
-0.4% | Sale (Partial)
$1,001 - $15,000 | 5/11/2023 | 4/14/2023 | -12.8%
 |
MDLZ Mondelez International | $73.17
-2.1% | Sale (Partial)
$1,001 - $15,000 | 5/11/2023 | 4/10/2023 | +3.7%
 |
KR Kroger | $45.41
-0.1% | Sale (Partial)
$1,001 - $15,000 | 5/11/2023 | 4/10/2023 | -7.1%
 |
HPQ HP | $28.42
+0.5% | Sale (Partial)
$1,001 - $15,000 | 5/11/2023 | 4/10/2023 | -4.4%
 |
PARA Paramount Global | $12.90
-0.8% | Sale (Partial)
$1,001 - $15,000 | 5/11/2023 | 4/10/2023 | -42.2%
 |
TSLA Tesla | $193.57
+2.1% | Sale (Partial)
$15,001 - $50,000 | 5/11/2023 | 4/4/2023 | +0.5%
 |
MSFT Microsoft | $420.55
+1.6% | Sale (Partial)
$15,001 - $50,000 | 5/11/2023 | 4/3/2023 | +46.4%
 |
GNTX Gentex | $35.32
+1.2% | Purchase
$1,001 - $15,000 | 5/11/2023 | 4/3/2023 | +26.6%
 |
GRMN Garmin | $123.27
+0.8% | Purchase
$1,001 - $15,000 | 5/11/2023 | 4/3/2023 | +22.4%
 |
GSK GSK | $41.91
+0.2% | Purchase
$1,001 - $15,000 | 5/11/2023 | 4/3/2023 | +16.6%
 |
FLT FLEETCOR Technologies | $273.40
+3.1% | Sale (Full)
$1,001 - $15,000 | 5/11/2023 | 4/3/2023 | +29.2%
 |
ETSY Etsy | $78.09
+4.8% | Sale (Full)
$1,001 - $15,000 | 5/11/2023 | 4/3/2023 | -27.9%
 |
EW Edwards Lifesciences | $85.01
-0.9% | Sale (Full)
$1,001 - $15,000 | 5/11/2023 | 4/3/2023 | +3.5%
 |
DIOD Diodes | $69.99
+1.8% | Purchase
$1,001 - $15,000 | 5/11/2023 | 4/3/2023 | -23.7%
 |
MPWR Monolithic Power Systems | $752.31
+2.1% | Sale (Partial)
$1,001 - $15,000 | 5/11/2023 | 4/3/2023 | +52.6%
 |
MTD Mettler-Toledo International | $1,174.51
-4.1% | Sale (Full)
$1,001 - $15,000 | 5/11/2023 | 4/3/2023 | -23.3%
 |
META Meta Platforms | $468.11
-0.4% | Sale (Full)
$1,001 - $15,000 | 5/11/2023 | 4/3/2023 | +119.7%
 |
MPWR Monolithic Power Systems | $752.31
+2.1% | Sale (Partial)
$1,001 - $15,000 | 5/11/2023 | 4/3/2023 | +52.6%
|
MCO Moody's | $405.17
+1.8% | Sale (Full)
$1,001 - $15,000 | 5/11/2023 | 4/3/2023 | +33.1%
 |
NVDA NVIDIA | $721.33
+3.6% | Purchase
$1,001 - $15,000 | 5/11/2023 | 4/3/2023 | +157.9%
 |
NDSN Nordson | $263.63
+0.7% | Purchase
$1,001 - $15,000 | 5/11/2023 | 4/3/2023 | +19.7%
 |
NSC Norfolk Southern | $254.83
+0.3% | Purchase
$1,001 - $15,000 | 5/11/2023 | 4/3/2023 | +22.1%
 |
PAM Pampa Energía | $44.08
+1.6% | Purchase
$1,001 - $15,000 | 5/11/2023 | 4/3/2023 | +27.3%
 |
PHM PulteGroup | $103.10
-0.2% | Sale (Full)
$1,001 - $15,000 | 5/11/2023 | 4/3/2023 | +74.7%
 |
RH RH | $261.14
+1.7% | Sale (Full)
$1,001 - $15,000 | 5/11/2023 | 4/3/2023 | +8.0%
 |
RRC Range Resources | $27.99
-1.7% | Purchase
$1,001 - $15,000 | 5/11/2023 | 4/3/2023 | +4.5%
 |
QSR Restaurant Brands International | $77.02
-0.2% | Purchase
$1,001 - $15,000 | 5/11/2023 | 4/3/2023 | +14.2%
 |
DQ Daqo New Energy | $19.83
+1.7% | Sale (Full)
$1,001 - $15,000 | 5/11/2023 | 4/3/2023 | -56.7%
 |
CROX Crocs | $107.54
+3.1% | Sale (Full)
$1,001 - $15,000 | 5/11/2023 | 4/3/2023 | -16.4%
 |
CBSH Commerce Bancshares | $51.16
+1.4% | Purchase
$1,001 - $15,000 | 5/11/2023 | 4/3/2023 | -13.0%
 |
CSCO Cisco Systems | $50.13
+0.4% | Sale (Full)
$15,001 - $50,000 | 5/11/2023 | 4/3/2023 | -4.2%
 |
CRUS Cirrus Logic | $93.06
-0.2% | Purchase
$1,001 - $15,000 | 5/11/2023 | 4/3/2023 | -13.5%
 |
AVGO Broadcom | $1,283.44
+0.7% | Purchase
$1,001 - $15,000 | 5/11/2023 | 4/3/2023 | +99.8%
 |
ADSK Autodesk | $266.68
+2.0% | Purchase
$1,001 - $15,000 | 5/11/2023 | 4/3/2023 | +28.5%
 |
ANET Arista Networks | $282.45
+2.4% | Sale (Full)
$15,001 - $50,000 | 5/11/2023 | 4/3/2023 | +68.4%
 |
APH Amphenol | $105.29
+0.4% | Purchase
$1,001 - $15,000 | 5/11/2023 | 4/3/2023 | +29.6%
 |
AMT American Tower | $194.44
+0.4% | Sale (Full)
$1,001 - $15,000 | 5/11/2023 | 4/3/2023 | -3.3%
 |
ALLE Allegion | $131.91
+1.1% | Sale (Full)
$1,001 - $15,000 | 5/11/2023 | 4/3/2023 | +24.4%
 |
ABBV AbbVie | $174.08
-0.4% | Sale (Partial)
$1,001 - $15,000 | 5/11/2023 | 4/3/2023 | +8.5%
 |
MMM 3M | $92.90
-0.3% | Purchase
$1,001 - $15,000 | 5/11/2023 | 4/3/2023 | -11.2%
 |
SSD Simpson Manufacturing | $192.40
+1.0% | Purchase
$1,001 - $15,000 | 5/11/2023 | 4/3/2023 | +75.0%
 |
VCTR Victory Capital | $36.77
+5.4% | Sale (Full)
$1,001 - $15,000 | 5/11/2023 | 4/3/2023 | +25.4%
 |
XP XP | $24.95
+1.2% | Purchase
$1,001 - $15,000 | 5/11/2023 | 4/3/2023 | +123.6%
 |
VZ Verizon Communications | $39.72
-0.5% | Purchase
$1,001 - $15,000 | 5/11/2023 | 4/3/2023 | +1.3%
 |
TREX Trex | $91.13
+0.8% | Sale (Full)
$1,001 - $15,000 | 5/11/2023 | 4/3/2023 | +84.6%
 |
TMO Thermo Fisher Scientific | $550.75
0.0% | Sale (Full)
$1,001 - $15,000 | 5/11/2023 | 4/3/2023 | -3.4%
 |
TXN Texas Instruments | $162.40
+1.4% | Sale (Partial)
$15,001 - $50,000 | 5/11/2023 | 4/3/2023 | -11.8%
 |
TSLA Tesla | $193.57
+2.1% | Purchase
$1,001 - $15,000 | 5/11/2023 | 4/3/2023 | -0.6%
 |
SKY Skyline Champion | $81.17
+2.1% | Purchase
$1,001 - $15,000 | 5/11/2023 | 4/3/2023 | +11.7%
 |
LMST Limestone Bancorp | $23.42
| Sale (Full)
$1,001 - $15,000 | 5/11/2023 | 4/3/2023 | +3.5%
 |
MKSI MKS Instruments | $119.80
+5.0% | Sale (Full)
$1,001 - $15,000 | 5/11/2023 | 4/3/2023 | +37.4%
 |
MMC Marsh & McLennan Companies | $197.91
+0.6% | Sale (Full)
$1,001 - $15,000 | 5/11/2023 | 4/3/2023 | +17.4%
 |
SCI Service Co. International | $67.24
+1.6% | Sale (Full)
$1,001 - $15,000 | 5/11/2023 | 4/3/2023 | -2.7%
 |
REGN Regeneron Pharmaceuticals | $953.42
+0.7% | Purchase
$1,001 - $15,000 | 5/11/2023 | 4/3/2023 | +15.4%
 |
ITW Illinois Tool Works | $255.75
+0.5% | Sale (Full)
$1,001 - $15,000 | 5/11/2023 | 4/3/2023 | +4.7%
 |
IDXX IDEXX Laboratories | $572.21
-0.2% | Purchase
$1,001 - $15,000 | 5/11/2023 | 4/3/2023 | +17.0%
 |
GFI Gold Fields | $13.48
-2.0% | Sale (Full)
$1,001 - $15,000 | 5/11/2023 | 4/3/2023 | +0.1%
 |
X United States Steel | $46.29
-0.2% | Sale (Partial)
$50,001 - $100,000 | 4/12/2023 | 3/21/2023 | +79.0%
 |
X United States Steel | $46.29
-0.2% | Sale (Partial)
$1,001 - $15,000 | 4/12/2023 | 3/21/2023 | +79.0%
|
X United States Steel | $46.29
-0.2% | Sale (Partial)
$1,001 - $15,000 | 4/12/2023 | 3/21/2023 | +79.0%
|
CLF Cleveland-Cliffs | $19.87
+2.8% | Purchase
$50,001 - $100,000 | 4/12/2023 | 3/21/2023 | +8.1%
 |
CLF Cleveland-Cliffs | $19.87
+2.8% | Sale (Partial)
$1,001 - $15,000 | 4/12/2023 | 3/21/2023 | +8.1%
|
TSM Taiwan Semiconductor Manufacturing | $133.11
-0.5% | Purchase
$1,001 - $15,000 | 4/12/2023 | 3/21/2023 | +43.9%
 |
X United States Steel | $46.29
-0.2% | Sale (Partial)
$50,001 - $100,000 | 4/12/2023 | 3/21/2023 | +79.0%
|
X United States Steel | $46.29
-0.2% | Sale (Partial)
$15,001 - $50,000 | 4/12/2023 | 3/21/2023 | +79.0%
|
X United States Steel | $46.29
-0.2% | Sale (Partial)
$15,001 - $50,000 | 4/12/2023 | 3/21/2023 | +79.0%
|
CLF Cleveland-Cliffs | $19.87
+2.8% | Sale (Partial)
$1,001 - $15,000 | 4/12/2023 | 3/21/2023 | +8.1%
|
X United States Steel | $46.29
-0.2% | Sale (Partial)
$50,001 - $100,000 | 4/12/2023 | 3/20/2023 | +85.8%
 |
KMB Kimberly-Clark | $119.81
-0.4% | Purchase
$15,001 - $50,000 | 4/12/2023 | 3/10/2023 | -2.1%
 |
BMO Bank of Montreal | $92.64
+0.8% | Sale (Full)
$1,001 - $15,000 | 4/12/2023 | 3/6/2023 | -3.4%
 |
CLF Cleveland-Cliffs | $19.87
+2.8% | Sale (Partial)
$1,001 - $15,000 | 4/12/2023 | 3/3/2023 | -12.8%
 |
GOLD Barrick Gold | $14.67
-1.0% | Purchase
$1,001 - $15,000 | 2/14/2023 | 1/23/2023 | +1530.0%
 |
CLF Cleveland-Cliffs | $19.87
+2.8% | Sale (Partial)
$1,001 - $15,000 | 2/14/2023 | 1/18/2023 | -4.2%
 |
CLF Cleveland-Cliffs | $19.87
+2.8% | Sale (Partial)
$1,001 - $15,000 | 2/14/2023 | 1/18/2023 | -4.2%
|
CLF Cleveland-Cliffs | $19.87
+2.8% | Purchase
$100,001 - $250,000 | 2/14/2023 | 1/18/2023 | -4.2%
|
UAA Under Armour | $8.09
+4.9% | Purchase
$15,001 - $50,000 | 2/14/2023 | 1/13/2023 | -29.6%
 |
CLF Cleveland-Cliffs | $19.87
+2.8% | Sale (Partial)
$1,001 - $15,000 | 2/14/2023 | 1/12/2023 | -4.9%
 |
TXN Texas Instruments | $162.40
+1.4% | Sale (Partial)
$1,001 - $15,000 | 2/14/2023 | 1/11/2023 | -9.2%
 |
AAPL Apple | $188.85
+0.3% | Sale (Partial)
$1,001 - $15,000 | 2/14/2023 | 1/11/2023 | +41.5%
 |
KO Coca-Cola | $59.56
-0.5% | Sale (Partial)
$1,001 - $15,000 | 2/14/2023 | 1/11/2023 | -4.0%
 |
V Visa | $276.43
+0.2% | Sale (Partial)
$1,001 - $15,000 | 2/14/2023 | 1/11/2023 | +24.5%
 |
CLF Cleveland-Cliffs | $19.87
+2.8% | Sale (Partial)
$15,001 - $50,000 | 2/14/2023 | 1/5/2023 | +12.9%
 |
CLF Cleveland-Cliffs | $19.87
+2.8% | Sale (Partial)
$1,001 - $15,000 | 2/14/2023 | 1/5/2023 | +12.9%
|
X United States Steel | $46.29
-0.2% | Purchase
$1,001 - $15,000 | 2/14/2023 | 1/5/2023 | +81.9%
 |
CLF Cleveland-Cliffs | $19.87
+2.8% | Sale (Partial)
$1,001 - $15,000 | 2/14/2023 | 1/5/2023 | +12.9%
|
X United States Steel | $46.29
-0.2% | Sale (Partial)
$1,001 - $15,000 | 2/14/2023 | 1/5/2023 | +81.9%
|
X United States Steel | $46.29
-0.2% | Sale (Partial)
$15,001 - $50,000 | 2/14/2023 | 1/5/2023 | +81.9%
|
X United States Steel | $46.29
-0.2% | Sale (Partial)
$1,001 - $15,000 | 2/14/2023 | 1/5/2023 | +81.9%
|
X United States Steel | $46.29
-0.2% | Sale (Partial)
$1,001 - $15,000 | 2/14/2023 | 1/5/2023 | +81.9%
|
X United States Steel | $46.29
-0.2% | Sale (Partial)
$50,001 - $100,000 | 2/14/2023 | 1/5/2023 | +81.9%
|
CLF Cleveland-Cliffs | $19.87
+2.8% | Sale (Partial)
$1,001 - $15,000 | 2/14/2023 | 1/5/2023 | +12.9%
|
GOLD Barrick Gold | $14.67
-1.0% | Purchase
$15,001 - $50,000 | 1/13/2023 | 12/23/2022 | +1530.0%
 |
NU NU | $9.89
+2.6% | Purchase
$1,001 - $15,000 | 1/13/2023 | 12/19/2022 | +152.9%
 |
DIS Walt Disney | $108.39
-1.9% | Sale (Partial)
$15,001 - $50,000 | 1/13/2023 | 12/15/2022 | +19.8%
 |
PYPL PayPal | $58.91
+5.0% | Sale (Partial)
$1,001 - $15,000 | 1/13/2023 | 12/9/2022 | -19.9%
 |
PYPL PayPal | $58.91
+5.0% | Sale (Partial)
$1,001 - $15,000 | 1/13/2023 | 12/9/2022 | -19.9%
|
PYPL PayPal | $58.91
+5.0% | Sale (Partial)
$50,001 - $100,000 | 1/13/2023 | 12/9/2022 | -19.9%
|
PYPL PayPal | $58.91
+5.0% | Sale (Partial)
$100,001 - $250,000 | 1/13/2023 | 12/9/2022 | -19.9%
|
KMB Kimberly-Clark | $119.81
-0.4% | Sale (Full)
$1,001 - $15,000 | 1/13/2023 | 12/9/2022 | -12.0%
 |
CLX Clorox | $153.20
-0.7% | Sale (Full)
$1,001 - $15,000 | 1/13/2023 | 12/9/2022 | +3.0%
 |
PG Procter & Gamble | $157.42
-0.8% | Sale (Full)
$1,001 - $15,000 | 1/13/2023 | 12/9/2022 | +4.3%
 |
PG Procter & Gamble | $157.42
-0.8% | Sale (Full)
$1,001 - $15,000 | 1/13/2023 | 12/9/2022 | +4.3%
|
PYPL PayPal | $58.91
+5.0% | Sale (Partial)
$1,001 - $15,000 | 1/13/2023 | 12/9/2022 | -19.9%
|
PYPL PayPal | $58.91
+5.0% | Sale (Partial)
$15,001 - $50,000 | 1/13/2023 | 12/9/2022 | -19.9%
|
PYPL PayPal | $58.91
+5.0% | Sale (Full)
$100,001 - $250,000 | 1/13/2023 | 12/9/2022 | -19.9%
|
PYPL PayPal | $58.91
+5.0% | Purchase
$15,001 - $50,000 | 1/13/2023 | 12/8/2022 | -20.6%
 |
GOLD Barrick Gold | $14.67
-1.0% | Purchase
$50,001 - $100,000 | 1/13/2023 | 12/6/2022 | +1530.0%
 |
PYPL PayPal | $58.91
+5.0% | Purchase
$250,001 - $500,000 | 1/13/2023 | 12/5/2022 | -20.0%
 |
QCOM QUALCOMM | $151.00
+1.9% | Sale (Full)
$15,001 - $50,000 | 1/13/2023 | 12/2/2022 | +20.2%
 |
QCOM QUALCOMM | $151.00
+1.9% | Sale (Partial)
$50,001 - $100,000 | 1/13/2023 | 12/2/2022 | +20.2%
|
QCOM QUALCOMM | $151.00
+1.9% | Purchase
$100,001 - $250,000 | 1/13/2023 | 12/1/2022 | +19.1%
 |
GOLD Barrick Gold | $14.67
-1.0% | Purchase
$1,001 - $15,000 | 1/13/2023 | 12/1/2022 | +1530.0%
 |
MSFT Microsoft | $420.55
+1.6% | Purchase
$1,001 - $15,000 | 12/14/2022 | 11/23/2022 | +69.9%
 |
TSM Taiwan Semiconductor Manufacturing | $133.11
-0.5% | Sale (Full)
$1,001 - $15,000 | 12/14/2022 | 11/23/2022 | +62.4%
 |
TSM Taiwan Semiconductor Manufacturing | $133.11
-0.5% | Sale (Full)
$1,001 - $15,000 | 12/14/2022 | 11/23/2022 | +62.4%
|
MSFT Microsoft | $420.55
+1.6% | Sale (Full)
$15,001 - $50,000 | 12/14/2022 | 11/23/2022 | +69.9%
|
F Ford Motor | $12.68
-1.2% | Sale (Full)
$100,001 - $250,000 | 12/14/2022 | 11/22/2022 | -9.9%
 |
INTC Intel | $43.31
+1.9% | Sale (Full)
$15,001 - $50,000 | 12/14/2022 | 11/22/2022 | +45.2%
 |
MSFT Microsoft | $420.55
+1.6% | Sale (Partial)
$100,001 - $250,000 | 12/14/2022 | 11/22/2022 | +71.6%
 |
F Ford Motor | $12.68
-1.2% | Purchase
$100,001 - $250,000 | 12/14/2022 | 11/17/2022 | -8.8%
 |
INTC Intel | $43.31
+1.9% | Purchase
$100,001 - $250,000 | 12/14/2022 | 11/9/2022 | +57.4%
 |
PYPL PayPal | $58.91
+5.0% | Sale (Full)
$50,001 - $100,000 | 12/14/2022 | 11/8/2022 | -27.4%
 |
PYPL PayPal | $58.91
+5.0% | Sale (Full)
$1,001 - $15,000 | 12/14/2022 | 11/8/2022 | -27.4%
|
ATVI Activision Blizzard | $94.42
-0.1% | Purchase
$100,001 - $250,000 | 12/14/2022 | 11/8/2022 | +31.1%
 |
X United States Steel | $46.29
-0.2% | Sale (Full)
$1,001 - $15,000 | 12/14/2022 | 11/8/2022 | +109.2%
 |
PYPL PayPal | $58.91
+5.0% | Sale (Full)
$1,001 - $15,000 | 12/14/2022 | 11/8/2022 | -27.4%
|
PYPL PayPal | $58.91
+5.0% | Sale (Partial)
$100,001 - $250,000 | 12/14/2022 | 11/8/2022 | -27.4%
|
PYPL PayPal | $58.91
+5.0% | Purchase
$100,001 - $250,000 | 12/14/2022 | 11/7/2022 | -24.1%
 |
CLF Cleveland-Cliffs | $19.87
+2.8% | Purchase
$50,001 - $100,000 | 12/14/2022 | 11/3/2022 | +67.4%
 |
NU NU | $9.89
+2.6% | Purchase
$1,001 - $15,000 | 12/14/2022 | 11/1/2022 | +94.3%
 |
CLF Cleveland-Cliffs | $19.87
+2.8% | Purchase
$1,001 - $15,000 | 12/14/2022 | 11/1/2022 | +48.8%
 |
CLF Cleveland-Cliffs | $19.87
+2.8% | Purchase
$15,001 - $50,000 | 11/10/2022 | 10/31/2022 | +53.0%
 |
MSFT Microsoft | $420.55
+1.6% | Sale (Full)
$1,001 - $15,000 | 11/10/2022 | 10/28/2022 | +78.3%
 |
MSFT Microsoft | $420.55
+1.6% | Sale (Full)
$1,001 - $15,000 | 11/10/2022 | 10/28/2022 | +78.3%
|
MSFT Microsoft | $420.55
+1.6% | Sale (Full)
$1,001 - $15,000 | 11/10/2022 | 10/28/2022 | +78.3%
|
FDX FedEx | $242.62
+0.4% | Sale (Full)
$1,001 - $15,000 | 11/10/2022 | 10/25/2022 | +55.7%
 |
MSFT Microsoft | $420.55
+1.6% | Purchase
$15,001 - $50,000 | 11/10/2022 | 10/24/2022 | +70.1%
 |
NU NU | $9.89
+2.6% | Purchase
$15,001 - $50,000 | 11/10/2022 | 10/13/2022 | +137.2%
 |
MSFT Microsoft | $420.55
+1.6% | Purchase
$250,001 - $500,000 | 11/10/2022 | 10/13/2022 | +79.5%
 |
NU NU | $9.89
+2.6% | Purchase
$1,001 - $15,000 | 11/10/2022 | 10/11/2022 | +141.2%
 |
X United States Steel | $46.29
-0.2% | Sale (Full)
$1,001 - $15,000 | 11/10/2022 | 10/6/2022 | +135.9%
 |
VCTR Victory Capital | $36.77
+5.4% | Purchase
$1,001 - $15,000 | 11/10/2022 | 10/6/2022 | +42.0%
 |
VCTR Victory Capital | $36.77
+5.4% | Purchase
$1,001 - $15,000 | 11/10/2022 | 10/6/2022 | +42.0%
|
VCTR Victory Capital | $36.77
+5.4% | Purchase
$1,001 - $15,000 | 11/10/2022 | 10/6/2022 | +42.0%
|
VRTX Vertex Pharmaceuticals | $422.91
0.0% | Purchase
$1,001 - $15,000 | 11/10/2022 | 10/6/2022 | +41.6%
 |
X United States Steel | $46.29
-0.2% | Sale (Full)
$15,001 - $50,000 | 11/10/2022 | 10/6/2022 | +135.9%
|
TREX Trex | $91.13
+0.8% | Purchase
$1,001 - $15,000 | 11/10/2022 | 10/6/2022 | +77.6%
 |
SCI Service Co. International | $67.24
+1.6% | Purchase
$1,001 - $15,000 | 11/10/2022 | 10/6/2022 | +10.2%
 |
RH RH | $261.14
+1.7% | Purchase
$1,001 - $15,000 | 11/10/2022 | 10/6/2022 | -1.4%
 |
RELX Relx | $42.48
+1.7% | Purchase
$1,001 - $15,000 | 11/10/2022 | 10/6/2022 | +68.2%
 |
PHM PulteGroup | $103.10
-0.2% | Purchase
$1,001 - $15,000 | 11/10/2022 | 10/6/2022 | +149.8%
 |
PAYC Paycom Software | $190.00
-2.9% | Purchase
$1,001 - $15,000 | 11/10/2022 | 10/6/2022 | -46.3%
 |
NU NU | $9.89
+2.6% | Purchase
$1,001 - $15,000 | 11/10/2022 | 10/6/2022 | +110.9%
 |
GIS General Mills | $62.34
-2.7% | Purchase
$1,001 - $15,000 | 11/10/2022 | 10/6/2022 | -16.8%
 |
GLPI Gaming and Leisure Properties | $45.72
+0.7% | Purchase
$1,001 - $15,000 | 11/10/2022 | 10/6/2022 | -1.6%
 |
RACE Ferrari | $392.56
+1.9% | Purchase
$1,001 - $15,000 | 11/10/2022 | 10/6/2022 | +105.7%
 |
XOM Exxon Mobil | $101.77
-2.1% | Sale (Full)
$15,001 - $50,000 | 11/10/2022 | 10/6/2022 | -0.3%
 |
XOM Exxon Mobil | $101.77
-2.1% | Purchase
$50,001 - $100,000 | 11/10/2022 | 10/6/2022 | -0.3%
|
EXR Extra Space Storage | $143.38
-0.1% | Purchase
$1,001 - $15,000 | 11/10/2022 | 10/6/2022 | -16.7%
 |
ETSY Etsy | $78.09
+4.8% | Purchase
$1,001 - $15,000 | 11/10/2022 | 10/6/2022 | -32.2%
 |
ELS Equity LifeStyle Properties | $66.81
+0.6% | Purchase
$1,001 - $15,000 | 11/10/2022 | 10/6/2022 | +7.2%
 |
AMGN Amgen | $291.12
-1.3% | Purchase
$1,001 - $15,000 | 11/10/2022 | 10/6/2022 | +26.1%
 |
CVX Chevron | $151.04
-2.0% | Sale (Full)
$15,001 - $50,000 | 11/10/2022 | 10/6/2022 | -6.4%
 |
CSCO Cisco Systems | $50.13
+0.4% | Purchase
$1,001 - $15,000 | 11/10/2022 | 10/6/2022 | +20.7%
 |
CROX Crocs | $107.54
+3.1% | Purchase
$1,001 - $15,000 | 11/10/2022 | 10/6/2022 | +36.8%
 |
DQ Daqo New Energy | $19.83
+1.7% | Purchase
$1,001 - $15,000 | 11/10/2022 | 10/6/2022 | -61.6%
 |
SEIC SEI Investments | $66.65
+0.5% | Sale (Full)
$1,001 - $15,000 | 11/10/2022 | 10/5/2022 | +30.6%
 |
TROW T. Rowe Price Group | $106.33
-2.4% | Sale (Full)
$1,001 - $15,000 | 11/10/2022 | 10/5/2022 | -4.7%
 |
RMD ResMed | $184.63
+0.5% | Sale (Full)
$1,001 - $15,000 | 11/10/2022 | 10/5/2022 | -20.3%
 |
NOC Northrop Grumman | $454.92
+0.8% | Sale (Full)
$1,001 - $15,000 | 11/10/2022 | 10/5/2022 | -6.1%
 |
NVDA NVIDIA | $721.33
+3.6% | Sale (Full)
$1,001 - $15,000 | 11/10/2022 | 10/5/2022 | +446.1%
 |
MNST Monster Beverage | $55.66
-1.5% | Sale (Full)
$1,001 - $15,000 | 11/10/2022 | 10/5/2022 | +20.8%
 |
MSFT Microsoft | $420.55
+1.6% | Sale (Partial)
$100,001 - $250,000 | 11/10/2022 | 10/5/2022 | +68.8%
 |
MASI Masimo | $135.07
-1.2% | Sale (Full)
$1,001 - $15,000 | 11/10/2022 | 10/5/2022 | -7.5%
 |
MKTX MarketAxess | $223.32
-0.4% | Sale (Full)
$1,001 - $15,000 | 11/10/2022 | 10/5/2022 | -6.8%
 |
IDXX IDEXX Laboratories | $572.21
-0.2% | Sale (Full)
$1,001 - $15,000 | 11/10/2022 | 10/5/2022 | +63.4%
 |
HON Honeywell International | $194.84
+0.7% | Sale (Full)
$1,001 - $15,000 | 11/10/2022 | 10/5/2022 | +9.6%
 |
GGG Graco | $88.16
+0.4% | Sale (Full)
$1,001 - $15,000 | 11/10/2022 | 10/5/2022 | +39.3%
 |
WIT Wipro | $5.86
+0.2% | Sale (Full)
$1,001 - $15,000 | 11/10/2022 | 10/5/2022 | +18.9%
 |
ZTS Zoetis | $197.32
+0.8% | Sale (Full)
$1,001 - $15,000 | 11/10/2022 | 10/5/2022 | +27.6%
 |
ALGN Align Technology | $296.37
+0.5% | Sale (Full)
$1,001 - $15,000 | 11/10/2022 | 10/5/2022 | +29.5%
 |
AMT American Tower | $194.44
+0.4% | Purchase
$1,001 - $15,000 | 11/10/2022 | 10/5/2022 | -9.2%
 |
AMAT Applied Materials | $185.84
+6.9% | Sale (Full)
$1,001 - $15,000 | 11/10/2022 | 10/5/2022 | +108.3%
 |
CHD Church & Dwight | $98.83
-1.1% | Sale (Full)
$1,001 - $15,000 | 11/10/2022 | 10/5/2022 | +36.3%
 |
IT Gartner | $463.52
+1.6% | Sale (Full)
$1,001 - $15,000 | 11/10/2022 | 10/5/2022 | +54.6%
 |
GRMN Garmin | $123.27
+0.8% | Sale (Full)
$1,001 - $15,000 | 11/10/2022 | 10/5/2022 | +48.3%
 |
FAST Fastenal | $70.02
+1.1% | Sale (Full)
$1,001 - $15,000 | 11/10/2022 | 10/5/2022 | +45.5%
 |
EL Estée Lauder Companies | $143.34
+1.8% | Sale (Full)
$1,001 - $15,000 | 11/10/2022 | 10/5/2022 | -36.6%
 |
DHI D.R. Horton | $144.91
+0.2% | Sale (Full)
$1,001 - $15,000 | 11/10/2022 | 10/5/2022 | +99.0%
 |
APD Air Products and Chemicals | $219.84
0.0% | Sale (Full)
$1,001 - $15,000 | 11/10/2022 | 10/5/2022 | -9.5%
 |
MRO Marathon Oil | $22.45
-1.1% | Sale (Full)
$1,001 - $15,000 | 11/10/2022 | 10/4/2022 | -15.3%
 |
OXY Occidental Petroleum | $57.47
-1.0% | Sale (Full)
$1,001 - $15,000 | 11/10/2022 | 10/4/2022 | -13.1%
 |
OXY Occidental Petroleum | $57.47
-1.0% | Purchase
$1,001 - $15,000 | 11/10/2022 | 10/4/2022 | -13.1%
|
OXY Occidental Petroleum | $57.47
-1.0% | Sale (Full)
$1,001 - $15,000 | 11/10/2022 | 10/4/2022 | -13.1%
|
OXY Occidental Petroleum | $57.47
-1.0% | Sale (Full)
$1,001 - $15,000 | 11/10/2022 | 10/4/2022 | -13.1%
|
X United States Steel | $46.29
-0.2% | Sale (Partial)
$1,001 - $15,000 | 10/12/2022 | 9/20/2022 | +127.7%
 |
MSFT Microsoft | $420.55
+1.6% | Sale (Partial)
$1,001 - $15,000 | 10/12/2022 | 9/20/2022 | +73.5%
 |
X United States Steel | $46.29
-0.2% | Purchase
$100,001 - $250,000 | 10/12/2022 | 9/19/2022 | +125.9%
 |
ARKK ARK Innovation ETF | $49.59
+2.4% | Purchase
$1,001 - $15,000 | 10/12/2022 | 9/19/2022 | +16.7%
 |
MSFT Microsoft | $420.55
+1.6% | Purchase
$250,001 - $500,000 | 10/12/2022 | 9/19/2022 | +72.0%
 |
F Ford Motor | $12.68
-1.2% | Sale (Full)
$15,001 - $50,000 | 10/12/2022 | 9/12/2022 | -18.4%
 |
F Ford Motor | $12.68
-1.2% | Purchase
$1,001 - $15,000 | 10/12/2022 | 9/12/2022 | -18.4%
|
F Ford Motor | $12.68
-1.2% | Purchase
$1,001 - $15,000 | 10/12/2022 | 9/12/2022 | -18.4%
|
ECOM ChannelAdvisor | $23.09
| Sale (Full)
$500,001 - $1,000,000 | 10/12/2022 | 9/7/2022 | +1.4%
 |
ARKK ARK Innovation ETF | $49.59
+2.4% | Purchase
$50,001 - $100,000 | 10/12/2022 | 9/7/2022 | +19.6%
 |
NU NU | $9.89
+2.6% | Purchase
$1,001 - $15,000 | 10/12/2022 | 9/6/2022 | +109.5%
 |
SSYS Stratasys | $12.97
-3.2% | Sale (Full)
$50,001 - $100,000 | 9/15/2022 | 8/26/2022 | -27.4%
 |
ARKK ARK Innovation ETF | $49.59
+2.4% | Purchase
$50,001 - $100,000 | 9/15/2022 | 8/25/2022 | +8.3%
 |
MRO Marathon Oil | $22.45
-1.1% | Purchase
$1,001 - $15,000 | 9/15/2022 | 8/18/2022 | -8.7%
 |
X United States Steel | $46.29
-0.2% | Purchase
$1,001 - $15,000 | 9/15/2022 | 8/12/2022 | +83.3%
 |
INTC Intel | $43.31
+1.9% | Purchase
$1,001 - $15,000 | 9/15/2022 | 8/5/2022 | +22.4%
 |
INTC Intel | $43.31
+1.9% | Purchase
$100,001 - $250,000 | 9/15/2022 | 8/5/2022 | +22.4%
|
PYPL PayPal | $58.91
+5.0% | Sale (Full)
$15,001 - $50,000 | 9/15/2022 | 8/3/2022 | -39.8%
 |
CLF Cleveland-Cliffs | $19.87
+2.8% | Sale (Full)
$1,001 - $15,000 | 9/15/2022 | 8/3/2022 | +16.1%
 |
OC Owens Corning | $148.21
-7.1% | Purchase
$15,001 - $50,000 | 9/15/2022 | 8/1/2022 | +59.5%
 |
MUB iShares National Muni Bond ETF | $107.71
+0.1% | Purchase
$50,001 - $100,000 | 9/15/2022 | 8/1/2022 | -0.7%
 |
EFAV iShares MSCI EAFE Min Vol Factor ETF | $68.25
+0.1% | Sale (Full)
$15,001 - $50,000 | 9/15/2022 | 8/1/2022 | +3.6%
 |
RSP Invesco S&P 500 Equal Weight ETF | $158.93
+0.1% | Purchase
$15,001 - $50,000 | 9/15/2022 | 8/1/2022 | +9.2%
 |
XLY Consumer Discretionary Select Sector SPDR Fund | $179.90
+0.7% | Sale (Full)
$15,001 - $50,000 | 9/15/2022 | 8/1/2022 | +9.9%
 |
XLC Communication Services Select Sector SPDR Fund | $79.17
+0.1% | Sale (Full)
$15,001 - $50,000 | 9/15/2022 | 8/1/2022 | +40.6%
 |
TSCO Tractor Supply | $235.08
+1.4% | Sale (Full)
$1,001 - $15,000 | 9/15/2022 | 8/1/2022 | +21.2%
 |
VTRS Viatris | $11.68
+1.0% | Sale (Full)
$1,001 - $15,000 | 9/15/2022 | 8/1/2022 | +20.9%
 |
DHS WisdomTree U.S. High Dividend Fund | $80.44
-0.1% | Purchase
$15,001 - $50,000 | 9/15/2022 | 8/1/2022 | -5.0%
 |
IVV iShares Core S&P 500 ETF | $503.65
+0.6% | Sale (Full)
$15,001 - $50,000 | 9/15/2022 | 8/1/2022 | +22.0%
 |
IDV iShares International Select Dividend ETF | $27.16
| Purchase
$15,001 - $50,000 | 9/15/2022 | 8/1/2022 | -1.5%
 |
ORCL Oracle | $116.64
0.0% | Sale (Full)
$1,001 - $15,000 | 9/15/2022 | 8/1/2022 | +50.6%
 |
CLF Cleveland-Cliffs | $19.87
+2.8% | Purchase
$50,001 - $100,000 | 8/15/2022 | 7/18/2022 | +27.9%
 |
ECOM ChannelAdvisor | $23.09
| Purchase
$100,001 - $250,000 | 8/15/2022 | 7/14/2022 | +63.2%
 |
PYPL PayPal | $58.91
+5.0% | Purchase
$50,001 - $100,000 | 7/13/2022 | 6/29/2022 | -17.6%
 |
QCOM QUALCOMM | $151.00
+1.9% | Sale (Partial)
$50,001 - $100,000 | 7/13/2022 | 6/28/2022 | +14.7%
 |
QCOM QUALCOMM | $151.00
+1.9% | Sale (Partial)
$250,001 - $500,000 | 7/13/2022 | 6/28/2022 | +14.7%
|
GOLD Barrick Gold | $14.67
-1.0% | Sale (Full)
$50,001 - $100,000 | 7/13/2022 | 6/22/2022 | +1530.0%
 |
X United States Steel | $46.29
-0.2% | Sale (Partial)
$1,001 - $15,000 | 7/13/2022 | 6/22/2022 | +142.7%
 |
GOLD Barrick Gold | $14.67
-1.0% | Purchase
$1,001 - $15,000 | 7/13/2022 | 6/22/2022 | +1530.0%
|
SSYS Stratasys | $12.97
-3.2% | Purchase
$1,001 - $15,000 | 7/13/2022 | 6/21/2022 | -31.0%
 |
INTC Intel | $43.31
+1.9% | Purchase
$50,001 - $100,000 | 7/13/2022 | 6/21/2022 | +14.8%
 |
X United States Steel | $46.29
-0.2% | Purchase
$100,001 - $250,000 | 7/13/2022 | 6/21/2022 | +136.2%
 |
EVT Eaton Vance Tax-Advantaged Dividend Income Fund | $22.17
-0.1% | Sale (Full)
$50,001 - $100,000 | 7/13/2022 | 6/17/2022 | -0.8%
 |
SCCO Southern Copper | $80.16
-1.0% | Sale (Full)
$100,001 - $250,000 | 7/13/2022 | 6/17/2022 | +44.6%
 |
BRK.B Berkshire Hathaway | $398.36
+0.2% | Sale (Full)
$100,001 - $250,000 | 7/13/2022 | 6/17/2022 | +48.3%
 |
CVX Chevron | $151.04
-2.0% | Sale (Full)
$1,001 - $15,000 | 7/13/2022 | 6/17/2022 | +1.8%
 |
PYPL PayPal | $58.91
+5.0% | Purchase
$100,001 - $250,000 | 7/13/2022 | 6/17/2022 | -19.2%
 |
PYPL PayPal | $58.91
+5.0% | Purchase
$1,001 - $15,000 | 7/13/2022 | 6/16/2022 | -17.3%
 |
QCOM QUALCOMM | $151.00
+1.9% | Purchase
$250,001 - $500,000 | 7/13/2022 | 6/16/2022 | +25.0%
 |
QCOM QUALCOMM | $151.00
+1.9% | Purchase
$1,001 - $15,000 | 7/13/2022 | 6/15/2022 | +15.2%
 |
PYPL PayPal | $58.91
+5.0% | Sale (Full)
$50,001 - $100,000 | 7/13/2022 | 6/15/2022 | -22.3%
 |
NVDA NVIDIA | $721.33
+3.6% | Purchase
$15,001 - $50,000 | 7/13/2022 | 6/15/2022 | +336.5%
 |
NVDA NVIDIA | $721.33
+3.6% | Sale (Full)
$15,001 - $50,000 | 7/13/2022 | 6/15/2022 | +336.5%
|
PYPL PayPal | $58.91
+5.0% | Purchase
$50,001 - $100,000 | 7/13/2022 | 6/15/2022 | -22.3%
|
SSYS Stratasys | $12.97
-3.2% | Purchase
$1,001 - $15,000 | 7/13/2022 | 6/14/2022 | -25.1%
 |
SSYS Stratasys | $12.97
-3.2% | Purchase
$15,001 - $50,000 | 7/13/2022 | 6/9/2022 | -29.8%
 |
INTC Intel | $43.31
+1.9% | Purchase
$15,001 - $50,000 | 7/13/2022 | 6/9/2022 | +8.2%
 |
NVDA NVIDIA | $721.33
+3.6% | Purchase
$1,001 - $15,000 | 7/13/2022 | 6/8/2022 | +286.8%
 |
EVT Eaton Vance Tax-Advantaged Dividend Income Fund | $22.17
-0.1% | Purchase
$15,001 - $50,000 | 7/13/2022 | 6/6/2022 | -12.5%
 |
ECOM ChannelAdvisor | $23.09
| Purchase
$1,001 - $15,000 | 7/13/2022 | 6/1/2022 | +62.7%
 |
X United States Steel | $46.29
-0.2% | Purchase
$100,001 - $250,000 | 6/13/2022 | 5/31/2022 | +84.6%
 |
X United States Steel | $46.29
-0.2% | Sale (Full)
$15,001 - $50,000 | 6/13/2022 | 5/31/2022 | +84.6%
|
X United States Steel | $46.29
-0.2% | Sale (Partial)
$15,001 - $50,000 | 6/13/2022 | 5/31/2022 | +84.6%
|
PYPL PayPal | $58.91
+5.0% | Purchase
$50,001 - $100,000 | 6/13/2022 | 5/20/2022 | -26.9%
 |
PYPL PayPal | $58.91
+5.0% | Purchase
$250,001 - $500,000 | 6/13/2022 | 5/19/2022 | -27.5%
 |
PYPL PayPal | $58.91
+5.0% | Purchase
$1,001 - $15,000 | 5/13/2022 | 4/28/2022 | -36.0%
 |
PYPL PayPal | $58.91
+5.0% | Sale (Full)
$50,001 - $100,000 | 5/13/2022 | 4/28/2022 | -36.0%
|
PYPL PayPal | $58.91
+5.0% | Sale (Full)
$50,001 - $100,000 | 5/13/2022 | 4/28/2022 | -36.0%
|
ECOM ChannelAdvisor | $23.09
| Purchase
$100,001 - $250,000 | 5/13/2022 | 4/21/2022 | +58.0%
 |
PYPL PayPal | $58.91
+5.0% | Purchase
$15,001 - $50,000 | 5/13/2022 | 4/11/2022 | -46.4%
 |
SQ Block | $66.88
-2.8% | Sale (Full)
$1,001 - $15,000 | 5/13/2022 | 4/11/2022 | -45.7%
 |
A Agilent Technologies | $133.34
-0.5% | Purchase
$1,001 - $15,000 | 5/11/2023 | 4/3/2022 | -0.5%
 |
AME AMETEK | $168.50
+1.3% | Purchase
$1,001 - $15,000 | 4/8/2022 | 3/30/2022 | +24.4%
 |
DHI D.R. Horton | $144.91
+0.2% | Purchase
$1,001 - $15,000 | 4/8/2022 | 3/30/2022 | +83.7%
 |
CFG Citizens Financial Group | $31.50
+0.4% | Purchase
$1,001 - $15,000 | 4/8/2022 | 3/30/2022 | -32.7%
 |
CE Celanese | $148.92
+0.0% | Sale (Full)
$1,001 - $15,000 | 4/8/2022 | 3/30/2022 | +3.0%
 |
CP Canadian Pacific Kansas City | $85.31
-0.2% | Sale (Full)
$1,001 - $15,000 | 4/8/2022 | 3/30/2022 | +2.1%
 |
CDNS Cadence Design Systems | $311.94
+1.5% | Purchase
$1,001 - $15,000 | 4/8/2022 | 3/30/2022 | +91.0%
 |
CABO Cable One | $498.15
+2.4% | Sale (Full)
$1,001 - $15,000 | 4/8/2022 | 3/30/2022 | -67.8%
 |
BKE Buckle | $39.80
+2.7% | Sale (Full)
$1,001 - $15,000 | 4/8/2022 | 3/30/2022 | +14.9%
 |
BIO Bio-Rad Laboratories | $325.22
-0.3% | Sale (Full)
$1,001 - $15,000 | 4/8/2022 | 3/30/2022 | -43.9%
 |
BMO Bank of Montreal | $92.64
+0.8% | Purchase
$1,001 - $15,000 | 4/8/2022 | 3/30/2022 | -22.0%
 |
GOOG Alphabet | $150.22
+2.0% | Purchase
$1,001 - $15,000 | 4/8/2022 | 3/30/2022 | +5.3%
 |
ABBV AbbVie | $174.08
-0.4% | Purchase
$1,001 - $15,000 | 4/8/2022 | 3/30/2022 | +6.3%
 |
ROK Rockwell Automation | $283.50
+1.7% | Sale (Full)
$1,001 - $15,000 | 4/8/2022 | 3/30/2022 | +1.0%
 |
RMD ResMed | $184.63
+0.5% | Purchase
$1,001 - $15,000 | 4/8/2022 | 3/30/2022 | -25.9%
 |
RF Regions Financial | $18.00
+0.6% | Purchase
$1,001 - $15,000 | 4/8/2022 | 3/30/2022 | -20.5%
 |
REGN Regeneron Pharmaceuticals | $953.42
+0.7% | Sale (Full)
$1,001 - $15,000 | 4/8/2022 | 3/30/2022 | +37.7%
 |
NOC Northrop Grumman | $454.92
+0.8% | Purchase
$1,001 - $15,000 | 4/8/2022 | 3/30/2022 | +0.4%
 |
NFLX Netflix | $561.32
+0.5% | Sale (Full)
$1,001 - $15,000 | 4/8/2022 | 3/30/2022 | +47.1%
 |
NDAQ Nasdaq | $57.25
+0.9% | Purchase
$1,001 - $15,000 | 4/8/2022 | 3/30/2022 | -5.6%
 |
KEY KeyCorp | $13.89
+0.1% | Purchase
$1,001 - $15,000 | 4/8/2022 | 3/30/2022 | -39.6%
 |
INTU Intuit | $658.16
+0.8% | Sale (Full)
$1,001 - $15,000 | 4/8/2022 | 3/30/2022 | +39.5%
 |
HUMA Humacyte | $3.63
+16.0% | Purchase
$15,001 - $50,000 | 4/8/2022 | 3/30/2022 | -50.1%
 |
HON Honeywell International | $194.84
+0.7% | Purchase
$1,001 - $15,000 | 4/8/2022 | 3/30/2022 | -0.9%
 |
GFI Gold Fields | $13.48
-2.0% | Purchase
$1,001 - $15,000 | 4/8/2022 | 3/30/2022 | -13.3%
 |
GNRC Generac | $126.91
-0.2% | Sale (Full)
$1,001 - $15,000 | 4/8/2022 | 3/30/2022 | -59.2%
 |
IT Gartner | $463.52
+1.6% | Purchase
$1,001 - $15,000 | 4/8/2022 | 3/30/2022 | +53.7%
 |
FGBI First Guaranty Bancshares | $11.31
+1.6% | Purchase
$1,001 - $15,000 | 4/8/2022 | 3/30/2022 | -52.9%
 |
FITB Fifth Third Bancorp | $33.65
+0.8% | Purchase
$1,001 - $15,000 | 4/8/2022 | 3/30/2022 | -24.0%
 |
EXP Eagle Materials | $243.22
-0.1% | Sale (Full)
$1,001 - $15,000 | 4/8/2022 | 3/30/2022 | +85.9%
 |
DEO Diageo | $146.48
-0.8% | Sale (Full)
$1,001 - $15,000 | 4/8/2022 | 3/30/2022 | -28.5%
 |
MRK Merck & Co., Inc. | $125.45
-0.9% | Purchase
$1,001 - $15,000 | 4/8/2022 | 3/30/2022 | |
MMC Marsh & McLennan Companies | $197.91
+0.6% | Purchase
$1,001 - $15,000 | 4/8/2022 | 3/30/2022 | +15.2%
 |
MKSI MKS Instruments | $119.80
+5.0% | Purchase
$1,001 - $15,000 | 4/8/2022 | 3/30/2022 | -23.4%
 |
LMST Limestone Bancorp | $23.42
| Purchase
$1,001 - $15,000 | 4/8/2022 | 3/30/2022 | +7.8%
 |
WST West Pharmaceutical Services | $409.64
-0.3% | Sale (Full)
$1,001 - $15,000 | 4/8/2022 | 3/30/2022 | -2.0%
 |
VMW VMware | $143.00
+0.4% | Sale (Full)
$1,001 - $15,000 | 4/8/2022 | 3/30/2022 | +23.1%
 |
VEEV Veeva Systems | $216.76
+0.6% | Sale (Full)
$1,001 - $15,000 | 4/8/2022 | 3/30/2022 | +1.3%
 |
TMO Thermo Fisher Scientific | $550.75
0.0% | Purchase
$1,001 - $15,000 | 4/8/2022 | 3/30/2022 | -7.5%
 |
SNA Snap-on | $262.43
-1.4% | Sale (Full)
$1,001 - $15,000 | 4/8/2022 | 3/30/2022 | +25.6%
 |
SPGI S&P Global | $437.89
+0.3% | Sale (Full)
$1,001 - $15,000 | 4/8/2022 | 3/30/2022 | +4.5%
 |
MASI Masimo | $135.07
-1.2% | Purchase
$1,001 - $15,000 | 4/8/2022 | 3/30/2022 | -13.1%
 |
GOLD Barrick Gold | $14.67
-1.0% | Sale (Full)
$1,001 - $15,000 | 4/8/2022 | 3/23/2022 | +1530.0%
 |
GOLD Barrick Gold | $14.67
-1.0% | Sale (Full)
$1,001 - $15,000 | 4/8/2022 | 3/23/2022 | +1530.0%
|
NU NU | $9.89
+2.6% | Purchase
$1,001 - $15,000 | 4/8/2022 | 3/22/2022 | +23.3%
 |
MSFT Microsoft | $420.55
+1.6% | Sale (Full)
$15,001 - $50,000 | 4/8/2022 | 3/22/2022 | +38.3%
 |
SCCO Southern Copper | $80.16
-1.0% | Purchase
$1,001 - $15,000 | 4/8/2022 | 3/22/2022 | +4.7%
 |
ECOM ChannelAdvisor | $23.09
| Purchase
$15,001 - $50,000 | 4/8/2022 | 3/21/2022 | +38.4%
 |
NU NU | $9.89
+2.6% | Purchase
$15,001 - $50,000 | 4/8/2022 | 3/21/2022 | +30.8%
 |
ECOM ChannelAdvisor | $23.09
| Purchase
$50,001 - $100,000 | 4/8/2022 | 3/8/2022 | +37.2%
 |
OXY Occidental Petroleum | $57.47
-1.0% | Sale (Partial)
$50,001 - $100,000 | 3/11/2022 | 2/22/2022 | +50.0%
 |
ARKK ARK Innovation ETF | $49.59
+2.4% | Sale (Full)
$1,001 - $15,000 | 3/11/2022 | 2/17/2022 | -27.3%
 |
ARKK ARK Innovation ETF | $49.59
+2.4% | Sale (Full)
$1,001 - $15,000 | 3/11/2022 | 2/17/2022 | -27.3%
|
X United States Steel | $46.29
-0.2% | Sale (Full)
$1,001 - $15,000 | 3/11/2022 | 2/10/2022 | +91.0%
 |
X United States Steel | $46.29
-0.2% | Sale (Full)
$1,001 - $15,000 | 3/11/2022 | 2/10/2022 | +91.0%
|
X United States Steel | $46.29
-0.2% | Purchase
$100,001 - $250,000 | 3/11/2022 | 2/10/2022 | +91.0%
|
X United States Steel | $46.29
-0.2% | Sale (Full)
$1,001 - $15,000 | 3/11/2022 | 2/10/2022 | +91.0%
|
PYPL PayPal | $58.91
+5.0% | Purchase
$15,001 - $50,000 | 3/11/2022 | 2/9/2022 | -52.1%
 |
PYPL PayPal | $58.91
+5.0% | Sale (Full)
$1,001 - $15,000 | 3/11/2022 | 2/9/2022 | -52.1%
|
PYPL PayPal | $58.91
+5.0% | Sale (Full)
$1,001 - $15,000 | 3/11/2022 | 2/9/2022 | -52.1%
|
PYPL PayPal | $58.91
+5.0% | Sale (Full)
$1,001 - $15,000 | 3/11/2022 | 2/9/2022 | -52.1%
|
ECOM ChannelAdvisor | $23.09
| Sale (Full)
$1,001 - $15,000 | 3/11/2022 | 2/7/2022 | +10.2%
 |
PYPL PayPal | $58.91
+5.0% | Purchase
$50,001 - $100,000 | 3/11/2022 | 2/7/2022 | -51.5%
 |
ECOM ChannelAdvisor | $23.09
| Sale (Full)
$1,001 - $15,000 | 3/11/2022 | 2/7/2022 | +10.2%
|
ECOM ChannelAdvisor | $23.09
| Sale (Full)
$1,001 - $15,000 | 3/11/2022 | 2/7/2022 | +10.2%
|
ECOM ChannelAdvisor | $23.09
| Sale (Full)
$1,001 - $15,000 | 3/11/2022 | 2/7/2022 | +10.2%
|
F Ford Motor | $12.68
-1.2% | Sale (Full)
$15,001 - $50,000 | 3/11/2022 | 2/1/2022 | -38.6%
 |
MSFT Microsoft | $420.55
+1.6% | Sale (Full)
$15,001 - $50,000 | 3/11/2022 | 2/1/2022 | +36.2%
 |
MRO Marathon Oil | $22.45
-1.1% | Sale (Full)
$1,001 - $15,000 | 3/11/2022 | 2/1/2022 | +8.7%
 |
MRO Marathon Oil | $22.45
-1.1% | Sale (Full)
$1,001 - $15,000 | 3/11/2022 | 2/1/2022 | +8.7%
|
CLF Cleveland-Cliffs | $19.87
+2.8% | Sale (Full)
$15,001 - $50,000 | 3/11/2022 | 2/1/2022 | +7.8%
 |
X United States Steel | $46.29
-0.2% | Sale (Full)
$1,001 - $15,000 | 3/11/2022 | 2/1/2022 | +114.5%
 |
GOLD Barrick Gold | $14.67
-1.0% | Purchase
$50,001 - $100,000 | 2/14/2022 | 1/24/2022 | +1530.0%
 |
XEL Xcel Energy | $58.17
+0.3% | Sale (Full)
$15,001 - $50,000 | 2/14/2022 | 1/21/2022 | -14.7%
 |
TSN Tyson Foods | $52.58
-2.6% | Sale (Full)
$15,001 - $50,000 | 2/14/2022 | 1/21/2022 | -41.5%
 |
PG Procter & Gamble | $157.42
-0.8% | Sale (Full)
$15,001 - $50,000 | 2/14/2022 | 1/21/2022 | -3.2%
 |
PM Philip Morris International | $89.12
+0.1% | Sale (Full)
$15,001 - $50,000 | 2/14/2022 | 1/21/2022 | -13.4%
 |
ABBV AbbVie | $174.08
-0.4% | Sale (Full)
$1,001 - $15,000 | 2/14/2022 | 1/21/2022 | +31.9%
 |
PEP PepsiCo | $167.67
-3.6% | Sale (Full)
$1,001 - $15,000 | 2/14/2022 | 1/21/2022 | -3.8%
 |
DUK Duke Energy | $91.69
-1.0% | Sale (Full)
$15,001 - $50,000 | 2/14/2022 | 1/21/2022 | -11.0%
 |
CTAS Cintas | $618.22
+0.2% | Sale (Full)
$15,001 - $50,000 | 2/14/2022 | 1/21/2022 | +62.9%
 |
MDT Medtronic | $84.99
-1.4% | Sale (Full)
$15,001 - $50,000 | 2/14/2022 | 1/21/2022 | -19.5%
 |
LMT Lockheed Martin | $426.50
-0.1% | Sale (Full)
$15,001 - $50,000 | 2/14/2022 | 1/21/2022 | +14.9%
 |
ACN Accenture | $371.67
+0.9% | Sale (Full)
$15,001 - $50,000 | 2/14/2022 | 1/14/2022 | +5.2%
 |
BABA Alibaba Group | $72.02
+1.8% | Purchase
$15,001 - $50,000 | 2/14/2022 | 1/14/2022 | -45.3%
 |
AWK American Water Works | $122.20
+0.3% | Sale (Full)
$15,001 - $50,000 | 2/14/2022 | 1/14/2022 | -25.3%
 |
AAPL Apple | $188.85
+0.3% | Sale (Full)
$15,001 - $50,000 | 2/14/2022 | 1/14/2022 | +9.1%
 |
CTAS Cintas | $618.22
+0.2% | Sale (Full)
$15,001 - $50,000 | 2/14/2022 | 1/14/2022 | +55.5%
 |
CLF Cleveland-Cliffs | $19.87
+2.8% | Purchase
$1,001 - $15,000 | 2/14/2022 | 1/14/2022 | -9.9%
 |
CLF Cleveland-Cliffs | $19.87
+2.8% | Sale (Full)
$1,001 - $15,000 | 2/14/2022 | 1/14/2022 | -9.9%
|
LLY Eli Lilly and Company | $740.16
+0.6% | Sale (Full)
$15,001 - $50,000 | 2/14/2022 | 1/14/2022 | +203.2%
 |
MA Mastercard | $457.88
-0.1% | Sale (Full)
$1,001 - $15,000 | 2/14/2022 | 1/14/2022 | +23.0%
 |
MSFT Microsoft | $420.55
+1.6% | Sale (Full)
$15,001 - $50,000 | 2/14/2022 | 1/14/2022 | +35.6%
 |
NEE NextEra Energy | $56.58
+0.5% | Sale (Full)
$15,001 - $50,000 | 2/14/2022 | 1/14/2022 | -32.0%
 |
QCOM QUALCOMM | $151.00
+1.9% | Sale (Full)
$15,001 - $50,000 | 2/14/2022 | 1/14/2022 | -20.0%
 |
QCOM QUALCOMM | $151.00
+1.9% | Sale (Full)
$15,001 - $50,000 | 2/14/2022 | 1/14/2022 | -20.0%
|
RTX RTX | $90.51
-0.6% | Sale (Full)
$1,001 - $15,000 | 2/14/2022 | 1/14/2022 | -2.0%
 |
WMT Walmart | $169.28
-0.1% | Sale (Full)
$1,001 - $15,000 | 2/14/2022 | 1/14/2022 | +16.7%
 |
BABA Alibaba Group | $72.02
+1.8% | Purchase
$50,001 - $100,000 | 2/14/2022 | 1/14/2022 | -45.3%
|
ADBE Adobe | $627.21
+1.8% | Sale (Full)
$15,001 - $50,000 | 2/14/2022 | 1/14/2022 | +20.5%
 |
BABA Alibaba Group | $72.02
+1.8% | Purchase
$15,001 - $50,000 | 2/14/2022 | 1/14/2022 | -45.3%
|
NWL Newell Brands | $6.85
-18.9% | Sale (Full)
$15,001 - $50,000 | 2/14/2022 | 1/13/2022 | -71.1%
 |
CLOU Global X Cloud Computing ETF | $23.47
+2.4% | Sale (Full)
$15,001 - $50,000 | 2/14/2022 | 1/13/2022 | -1.3%
 |
GILD Gilead Sciences | $73.67
-0.2% | Sale (Full)
$1,001 - $15,000 | 2/14/2022 | 1/13/2022 | +2.5%
 |
CRWD CrowdStrike | $329.34
+2.0% | Sale (Full)
$15,001 - $50,000 | 2/14/2022 | 1/13/2022 | +88.3%
 |
VTRS Viatris | $11.68
+1.0% | Sale (Full)
$1,001 - $15,000 | 2/14/2022 | 1/13/2022 | -22.2%
 |
FUN Cedar Fair | $41.96
+1.0% | Sale (Full)
$15,001 - $50,000 | 2/14/2022 | 1/13/2022 | -11.0%
 |
X United States Steel | $46.29
-0.2% | Sale (Full)
$15,001 - $50,000 | 2/14/2022 | 1/13/2022 | +82.1%
 |
PEGA Pegasystems | $49.94
+0.4% | Sale (Full)
$15,001 - $50,000 | 2/14/2022 | 1/13/2022 | -49.6%
 |
IBM International Business Machines | $186.34
+1.1% | Purchase
$1,001 - $15,000 | 2/14/2022 | 1/12/2022 | +39.5%
 |
MMM 3M | $92.90
-0.3% | Purchase
$1,001 - $15,000 | 2/14/2022 | 1/12/2022 | -48.2%
 |
AMGN Amgen | $291.12
-1.3% | Purchase
$1,001 - $15,000 | 2/14/2022 | 1/12/2022 | +25.6%
 |
CVX Chevron | $151.04
-2.0% | Purchase
$1,001 - $15,000 | 2/14/2022 | 1/12/2022 | +18.6%
 |
CSCO Cisco Systems | $50.13
+0.4% | Purchase
$1,001 - $15,000 | 2/14/2022 | 1/12/2022 | -19.3%
 |
KO Coca-Cola | $59.56
-0.5% | Purchase
$1,001 - $15,000 | 2/14/2022 | 1/12/2022 | -1.6%
 |
DOW DOW | $53.99
+0.2% | Purchase
$1,001 - $15,000 | 2/14/2022 | 1/12/2022 | -8.9%
 |
INTC Intel | $43.31
+1.9% | Purchase
$15,001 - $50,000 | 2/14/2022 | 1/12/2022 | -22.3%
 |
INTC Intel | $43.31
+1.9% | Purchase
$1,001 - $15,000 | 2/14/2022 | 1/12/2022 | -22.3%
|
PFE Pfizer | $27.56
0.0% | Purchase
$1,001 - $15,000 | 2/14/2022 | 1/12/2022 | -51.4%
 |
VZ Verizon Communications | $39.72
-0.5% | Purchase
$1,001 - $15,000 | 2/14/2022 | 1/12/2022 | -25.7%
 |
WBA Walgreens Boots Alliance | $22.24
-1.3% | Purchase
$1,001 - $15,000 | 2/14/2022 | 1/12/2022 | -58.7%
 |
INTC Intel | $43.31
+1.9% | Sale (Full)
$1,001 - $15,000 | 2/14/2022 | 1/5/2022 | -19.6%
 |
INTC Intel | $43.31
+1.9% | Sale (Full)
$1,001 - $15,000 | 2/14/2022 | 1/5/2022 | -19.6%
|
CLF Cleveland-Cliffs | $19.87
+2.8% | Sale (Full)
$1,001 - $15,000 | 2/14/2022 | 1/4/2022 | -12.2%
 |
SSYS Stratasys | $12.97
-3.2% | Sale (Full)
$1,001 - $15,000 | 2/14/2022 | 1/3/2022 | -48.3%
 |
SSYS Stratasys | $12.97
-3.2% | Sale (Full)
$1,001 - $15,000 | 2/14/2022 | 1/3/2022 | -48.3%
|
SSYS Stratasys | $12.97
-3.2% | Sale (Full)
$1,001 - $15,000 | 2/14/2022 | 1/3/2022 | -48.3%
|
SSYS Stratasys | $12.97
-3.2% | Sale (Full)
$1,001 - $15,000 | 2/14/2022 | 1/3/2022 | -48.3%
|
QQQ Invesco QQQ Trust | $437.05
+1.0% | Purchase
$1,001 - $15,000 | 1/12/2022 | 12/29/2021 | +8.8%
 |
PYPL PayPal | $58.91
+5.0% | Sale (Full)
$15,001 - $50,000 | 1/12/2022 | 12/29/2021 | -69.0%
 |
ECOM ChannelAdvisor | $23.09
| Sale (Full)
$15,001 - $50,000 | 1/12/2022 | 12/27/2021 | -8.1%
 |
BABA Alibaba Group | $72.02
+1.8% | Sale (Partial)
$50,001 - $100,000 | 1/12/2022 | 12/23/2021 | -39.3%
 |
ECOM ChannelAdvisor | $23.09
| Sale (Full)
$15,001 - $50,000 | 1/12/2022 | 12/23/2021 | -6.6%
 |
ECOM ChannelAdvisor | $23.09
| Sale (Full)
$1,001 - $15,000 | 1/12/2022 | 12/23/2021 | -6.6%
|
CLF Cleveland-Cliffs | $19.87
+2.8% | Purchase
$1,001 - $15,000 | 1/12/2022 | 12/23/2021 | -2.1%
 |
AAPL Apple | $188.85
+0.3% | Sale (Partial)
$50,001 - $100,000 | 1/12/2022 | 12/22/2021 | +7.5%
 |
BABA Alibaba Group | $72.02
+1.8% | Purchase
$15,001 - $50,000 | 1/12/2022 | 12/21/2021 | -41.4%
 |
BABA Alibaba Group | $72.02
+1.8% | Purchase
$50,001 - $100,000 | 1/12/2022 | 12/15/2021 | -41.2%
 |
BABA Alibaba Group | $72.02
+1.8% | Purchase
$50,001 - $100,000 | 1/12/2022 | 12/14/2021 | -43.1%
 |
SSYS Stratasys | $12.97
-3.2% | Purchase
$15,001 - $50,000 | 1/12/2022 | 12/13/2021 | -44.6%
 |
MSFT Microsoft | $420.55
+1.6% | Purchase
$1,001 - $15,000 | 12/10/2021 | 11/22/2021 | +23.8%
 |
AAPL Apple | $188.85
+0.3% | Purchase
$1,001 - $15,000 | 12/10/2021 | 11/22/2021 | +17.3%
 |
OXY Occidental Petroleum | $57.47
-1.0% | Sale (Full)
$1,001 - $15,000 | 12/10/2021 | 11/22/2021 | +91.5%
 |
OXY Occidental Petroleum | $57.47
-1.0% | Sale (Full)
$50,001 - $100,000 | 12/10/2021 | 11/22/2021 | +91.5%
|
ECOM ChannelAdvisor | $23.09
| Purchase
$1,001 - $15,000 | 12/10/2021 | 11/22/2021 | -10.4%
 |
PYPL PayPal | $58.91
+5.0% | Sale (Full)
$1,001 - $15,000 | 12/10/2021 | 11/17/2021 | -71.4%
 |
PYPL PayPal | $58.91
+5.0% | Sale (Partial)
$1,001 - $15,000 | 12/10/2021 | 11/17/2021 | -71.4%
|
PYPL PayPal | $58.91
+5.0% | Sale (Full)
$1,001 - $15,000 | 12/10/2021 | 11/17/2021 | -71.4%
|
ADBE Adobe | $627.21
+1.8% | Purchase
$1,001 - $15,000 | 12/10/2021 | 11/12/2021 | -4.6%
 |
CLF Cleveland-Cliffs | $19.87
+2.8% | Sale (Full)
$15,001 - $50,000 | 12/10/2021 | 11/8/2021 | -15.8%
 |
CLF Cleveland-Cliffs | $19.87
+2.8% | Sale (Full)
$1,001 - $15,000 | 12/10/2021 | 11/8/2021 | -15.8%
|
CLF Cleveland-Cliffs | $19.87
+2.8% | Purchase
$100,001 - $250,000 | 12/10/2021 | 11/8/2021 | -15.8%
|
CLF Cleveland-Cliffs | $19.87
+2.8% | Sale (Full)
$15,001 - $50,000 | 12/10/2021 | 11/8/2021 | -15.8%
|
F Ford Motor | $12.68
-1.2% | Purchase
$1,001 - $15,000 | 12/10/2021 | 11/5/2021 | -34.3%
 |
F Ford Motor | $12.68
-1.2% | Purchase
$1,001 - $15,000 | 12/10/2021 | 11/5/2021 | -34.3%
|
SSYS Stratasys | $12.97
-3.2% | Sale (Full)
$1,001 - $15,000 | 12/10/2021 | 11/4/2021 | -64.2%
 |
SCCO Southern Copper | $80.16
-1.0% | Sale (Full)
$1,001 - $15,000 | 12/10/2021 | 11/2/2021 | +33.2%
 |
SCCO Southern Copper | $80.16
-1.0% | Purchase
$100,001 - $250,000 | 12/10/2021 | 11/2/2021 | +33.2%
|
SCCO Southern Copper | $80.16
-1.0% | Sale (Full)
$1,001 - $15,000 | 12/10/2021 | 11/2/2021 | +33.2%
|
SCCO Southern Copper | $80.16
-1.0% | Purchase
$1,001 - $15,000 | 12/10/2021 | 11/2/2021 | +33.2%
|
RMD ResMed | $184.63
+0.5% | Sale (Full)
$1,001 - $15,000 | 11/10/2021 | 10/26/2021 | -31.0%
 |
APAM Artisan Partners Asset Management | $42.86
+1.1% | Sale (Full)
$1,001 - $15,000 | 11/10/2021 | 10/26/2021 | |
AON AON | $312.56
+1.8% | Sale (Full)
$1,001 - $15,000 | 11/10/2021 | 10/26/2021 | -2.4%
 |
QCOM QUALCOMM | $151.00
+1.9% | Sale (Full)
$1,001 - $15,000 | 11/10/2021 | 10/26/2021 | +14.4%
 |
X United States Steel | $46.29
-0.2% | Sale (Full)
$1,001 - $15,000 | 11/10/2021 | 10/21/2021 | +108.4%
 |
X United States Steel | $46.29
-0.2% | Purchase
$100,001 - $250,000 | 11/10/2021 | 10/18/2021 | +111.9%
 |
INTC Intel | $43.31
+1.9% | Sale (Full)
$1,001 - $15,000 | 11/10/2021 | 10/18/2021 | -20.5%
 |
GE General Electric | $139.28
+0.2% | Sale (Full)
$15,001 - $50,000 | 11/10/2021 | 10/18/2021 | +33.8%
 |
X United States Steel | $46.29
-0.2% | Sale (Full)
$1,001 - $15,000 | 11/10/2021 | 10/18/2021 | +111.9%
|
GD General Dynamics | $270.14
+0.4% | Sale (Full)
$15,001 - $50,000 | 11/10/2021 | 10/18/2021 | +30.7%
 |
DOW DOW | $53.99
+0.2% | Sale (Full)
$1,001 - $15,000 | 11/10/2021 | 10/18/2021 | -8.4%
 |
UA Under Armour | $7.84
+5.1% | Sale (Full)
$15,001 - $50,000 | 11/10/2021 | 10/18/2021 | -56.3%
 |
D Dominion Energy | $44.70
+1.2% | Sale (Full)
$15,001 - $50,000 | 11/10/2021 | 10/18/2021 | -37.9%
 |
CALX Calix | $34.64
+1.1% | Sale (Full)
$1,001 - $15,000 | 11/10/2021 | 10/18/2021 | -40.0%
 |
CALX Calix | $34.64
+1.1% | Sale (Full)
$1,001 - $15,000 | 11/10/2021 | 10/18/2021 | -40.0%
|
CALX Calix | $34.64
+1.1% | Purchase
$1,001 - $15,000 | 11/10/2021 | 10/18/2021 | -40.0%
|
BDX Becton, Dickinson and Company | $243.75
+1.3% | Sale (Full)
$15,001 - $50,000 | 11/10/2021 | 10/18/2021 | +2.2%
 |
AA Alcoa | $26.89
-3.0% | Sale (Full)
$100,001 - $250,000 | 11/10/2021 | 10/18/2021 | -53.0%
 |
UAA Under Armour | $8.09
+4.9% | Sale (Full)
$15,001 - $50,000 | 11/10/2021 | 10/18/2021 | -60.6%
 |
INTC Intel | $43.31
+1.9% | Purchase
$50,001 - $100,000 | 11/10/2021 | 10/18/2021 | -20.5%
|
AA Alcoa | $26.89
-3.0% | Sale (Full)
$1,001 - $15,000 | 11/10/2021 | 10/15/2021 | -52.0%
 |
INTC Intel | $43.31
+1.9% | Purchase
$15,001 - $50,000 | 11/10/2021 | 10/15/2021 | -20.5%
 |
GNRC Generac | $126.91
-0.2% | Purchase
$1,001 - $15,000 | 10/15/2021 | 9/30/2021 | -68.9%
 |
INTU Intuit | $658.16
+0.8% | Purchase
$1,001 - $15,000 | 10/15/2021 | 9/30/2021 | +22.0%
 |
JNJ Johnson & Johnson | $156.76
+0.2% | Purchase
$1,001 - $15,000 | 10/15/2021 | 9/30/2021 | -2.9%
 |
KLAC KLA | $649.80
+5.1% | Purchase
$1,001 - $15,000 | 10/15/2021 | 9/30/2021 | +94.3%
 |
KEYS Keysight Technologies | $161.52
+0.2% | Purchase
$1,001 - $15,000 | 10/15/2021 | 9/30/2021 | -1.7%
 |
MPWR Monolithic Power Systems | $752.31
+2.1% | Purchase
$1,001 - $15,000 | 10/15/2021 | 9/30/2021 | +55.2%
 |
PG Procter & Gamble | $157.42
-0.8% | Purchase
$1,001 - $15,000 | 10/15/2021 | 9/30/2021 | +12.6%
 |
NFLX Netflix | $561.32
+0.5% | Purchase
$1,001 - $15,000 | 10/15/2021 | 9/30/2021 | -8.0%
 |
BKE Buckle | $39.80
+2.7% | Purchase
$1,001 - $15,000 | 10/15/2021 | 9/30/2021 | +0.5%
 |
APD Air Products and Chemicals | $219.84
0.0% | Purchase
$1,001 - $15,000 | 10/15/2021 | 9/30/2021 | -14.2%
 |
ALLE Allegion | $131.91
+1.1% | Purchase
$1,001 - $15,000 | 10/15/2021 | 9/30/2021 | -0.2%
 |
CABO Cable One | $498.15
+2.4% | Purchase
$1,001 - $15,000 | 10/15/2021 | 9/30/2021 | -72.5%
 |
CTAS Cintas | $618.22
+0.2% | Purchase
$1,001 - $15,000 | 10/15/2021 | 9/30/2021 | +62.4%
 |
DEO Diageo | $146.48
-0.8% | Purchase
$1,001 - $15,000 | 10/15/2021 | 9/30/2021 | -24.1%
 |
EXP Eagle Materials | $243.22
-0.1% | Purchase
$1,001 - $15,000 | 10/15/2021 | 9/30/2021 | +85.4%
 |
EL Estée Lauder Companies | $143.34
+1.8% | Purchase
$1,001 - $15,000 | 10/15/2021 | 9/30/2021 | -52.2%
 |
MMM 3M | $92.90
-0.3% | Sale (Full)
$1,001 - $15,000 | 10/15/2021 | 9/29/2021 | -48.6%
 |
WAL Western Alliance Bancorporation | $61.57
+4.5% | Sale (Full)
$1,001 - $15,000 | 10/15/2021 | 9/29/2021 | -43.4%
 |
DECK Deckers Outdoor | $845.22
+1.5% | Sale (Full)
$1,001 - $15,000 | 10/15/2021 | 9/29/2021 | +127.0%
 |
CLX Clorox | $153.20
-0.7% | Sale (Full)
$1,001 - $15,000 | 10/15/2021 | 9/29/2021 | -8.9%
 |
CHE Chemed | $589.00
-0.6% | Sale (Full)
$1,001 - $15,000 | 10/15/2021 | 9/29/2021 | +25.5%
 |
BHP BHP Group | $60.18
+0.2% | Sale (Full)
$1,001 - $15,000 | 10/15/2021 | 9/29/2021 | +14.4%
 |
ATHM Autohome | $25.63
+1.0% | Sale (Full)
$1,001 - $15,000 | 10/15/2021 | 9/29/2021 | -43.3%
 |
AME AMETEK | $168.50
+1.3% | Sale (Full)
$1,001 - $15,000 | 10/15/2021 | 9/29/2021 | +32.9%
 |
X United States Steel | $46.29
-0.2% | Sale (Full)
$15,001 - $50,000 | 10/15/2021 | 9/20/2021 | +112.0%
 |
SSYS Stratasys | $12.97
-3.2% | Purchase
$50,001 - $100,000 | 10/15/2021 | 9/20/2021 | -41.6%
 |
BABA Alibaba Group | $72.02
+1.8% | Purchase
$50,001 - $100,000 | 10/15/2021 | 9/13/2021 | -56.5%
 |
BABA Alibaba Group | $72.02
+1.8% | Sale (Full)
$15,001 - $50,000 | 10/15/2021 | 9/13/2021 | -56.5%
|
BABA Alibaba Group | $72.02
+1.8% | Sale (Full)
$1,001 - $15,000 | 10/15/2021 | 9/13/2021 | -56.5%
|
BABA Alibaba Group | $72.02
+1.8% | Sale (Full)
$15,001 - $50,000 | 10/15/2021 | 9/13/2021 | -56.5%
|
ECOM ChannelAdvisor | $23.09
| Purchase
$1,001 - $15,000 | 10/15/2021 | 9/3/2021 | -14.9%
 |
CALX Calix | $34.64
+1.1% | Sale (Full)
$1,001 - $15,000 | 9/8/2021 | 8/30/2021 | -26.4%
 |
ECOM ChannelAdvisor | $23.09
| Sale (Full)
$1,001 - $15,000 | 9/8/2021 | 8/30/2021 | -9.9%
 |
ECOM ChannelAdvisor | $23.09
| Sale (Full)
$1,001 - $15,000 | 9/8/2021 | 8/30/2021 | -9.9%
|
CALX Calix | $34.64
+1.1% | Purchase
$1,001 - $15,000 | 9/8/2021 | 8/27/2021 | -28.0%
 |
SSYS Stratasys | $12.97
-3.2% | Purchase
$1,001 - $15,000 | 9/8/2021 | 8/18/2021 | -35.8%
 |
SSBK Southern States Bancshares | $26.75
+2.3% | Purchase
$50,001 - $100,000 | 9/8/2021 | 8/12/2021 | |
INTC Intel | $43.31
+1.9% | Sale (Full)
$1,001 - $15,000 | 9/8/2021 | 8/10/2021 | -19.7%
 |
OXY Occidental Petroleum | $57.47
-1.0% | Sale (Full)
$1,001 - $15,000 | 9/8/2021 | 8/2/2021 | +122.8%
 |
OXY Occidental Petroleum | $57.47
-1.0% | Sale (Full)
$1,001 - $15,000 | 9/8/2021 | 8/2/2021 | +122.8%
|
F Ford Motor | $12.68
-1.2% | Sale (Full)
$15,001 - $50,000 | 8/13/2021 | 7/30/2021 | -9.1%
 |
AA Alcoa | $26.89
-3.0% | Purchase
$1,001 - $15,000 | 8/13/2021 | 7/29/2021 | -31.7%
 |
NVDA NVIDIA | $721.33
+3.6% | Sale (Full)
$15,001 - $50,000 | 8/13/2021 | 7/28/2021 | +269.9%
 |
CLF Cleveland-Cliffs | $19.87
+2.8% | Purchase
$100,001 - $250,000 | 8/13/2021 | 7/21/2021 | -6.2%
 |
CLF Cleveland-Cliffs | $19.87
+2.8% | Sale (Full)
$15,001 - $50,000 | 8/13/2021 | 7/21/2021 | -6.2%
|
CLF Cleveland-Cliffs | $19.87
+2.8% | Sale (Full)
$1,001 - $15,000 | 8/13/2021 | 7/21/2021 | -6.2%
|
CLF Cleveland-Cliffs | $19.87
+2.8% | Sale (Full)
$1,001 - $15,000 | 8/13/2021 | 7/21/2021 | -6.2%
|
CLF Cleveland-Cliffs | $19.87
+2.8% | Sale (Full)
$1,001 - $15,000 | 8/13/2021 | 7/21/2021 | -6.2%
|
CLF Cleveland-Cliffs | $19.87
+2.8% | Sale (Full)
$1,001 - $15,000 | 8/13/2021 | 7/20/2021 | -0.9%
 |
CLF Cleveland-Cliffs | $19.87
+2.8% | Sale (Full)
$1,001 - $15,000 | 8/13/2021 | 7/20/2021 | -0.9%
|
CLF Cleveland-Cliffs | $19.87
+2.8% | Sale (Full)
$50,001 - $100,000 | 8/13/2021 | 7/19/2021 | +3.2%
 |
AA Alcoa | $26.89
-3.0% | Sale (Full)
$50,001 - $100,000 | 8/13/2021 | 7/19/2021 | -15.0%
 |
SQ Block | $66.88
-2.8% | Purchase
$15,001 - $50,000 | 8/13/2021 | 7/16/2021 | -71.8%
 |
MTUM iShares MSCI USA Momentum Factor ETF | $178.46
+1.3% | Purchase
$15,001 - $50,000 | 8/13/2021 | 7/16/2021 | +5.4%
 |
NWL Newell Brands | $6.85
-18.9% | Purchase
$15,001 - $50,000 | 8/13/2021 | 7/16/2021 | -74.7%
 |
CRWD CrowdStrike | $329.34
+2.0% | Purchase
$15,001 - $50,000 | 8/13/2021 | 7/16/2021 | +31.8%
 |
XLY Consumer Discretionary Select Sector SPDR Fund | $179.90
+0.7% | Purchase
$15,001 - $50,000 | 8/13/2021 | 7/16/2021 | +1.1%
 |
DTD WisdomTree Total U.S. Dividend Fund | $66.68
+0.1% | Purchase
$15,001 - $50,000 | 8/13/2021 | 7/16/2021 | +11.5%
 |
PEP PepsiCo | $167.67
-3.6% | Purchase
$15,001 - $50,000 | 8/13/2021 | 7/16/2021 | +7.6%
 |
PEGA Pegasystems | $49.94
+0.4% | Purchase
$15,001 - $50,000 | 8/13/2021 | 7/16/2021 | -62.3%
 |
BABA Alibaba Group | $72.02
+1.8% | Purchase
$15,001 - $50,000 | 8/13/2021 | 7/14/2021 | -65.9%
 |
BABA Alibaba Group | $72.02
+1.8% | Sale (Full)
$15,001 - $50,000 | 8/13/2021 | 7/14/2021 | -65.9%
|
QQQ Invesco QQQ Trust | $437.05
+1.0% | Purchase
$1,001 - $15,000 | 8/13/2021 | 7/6/2021 | +21.3%
 |
INTC Intel | $43.31
+1.9% | Sale (Full)
$1,001 - $15,000 | 8/13/2021 | 7/1/2021 | -22.7%
 |
ADP Automatic Data Processing | $249.99
-0.4% | Purchase
$1,001 - $15,000 | 7/16/2021 | 6/30/2021 | +25.9%
 |
OXY Occidental Petroleum | $57.47
-1.0% | Purchase
$1,001 - $15,000 | 7/16/2021 | 6/25/2021 | +74.6%
 |
AAPL Apple | $188.85
+0.3% | Sale (Full)
$1,001 - $15,000 | 7/16/2021 | 6/23/2021 | +41.2%
 |
MSFT Microsoft | $420.55
+1.6% | Sale (Full)
$1,001 - $15,000 | 7/16/2021 | 6/23/2021 | +58.5%
 |
QCOM QUALCOMM | $151.00
+1.9% | Sale (Full)
$15,001 - $50,000 | 7/16/2021 | 6/1/2021 | +12.7%
 |
FCX Freeport-McMoRan | $37.36
-2.0% | Sale (Full)
$1,001 - $15,000 | 7/23/2021 | 5/24/2021 | -10.1%
 |
FCX Freeport-McMoRan | $37.36
-2.0% | Sale (Full)
$1,001 - $15,000 | 7/23/2021 | 5/10/2021 | -12.6%
 |
X United States Steel | $46.29
-0.2% | Sale (Full)
$1,001 - $15,000 | 7/23/2021 | 5/6/2021 | +78.3%
 |
X United States Steel | $46.29
-0.2% | Sale (Full)
$15,001 - $50,000 | 7/23/2021 | 5/6/2021 | +78.3%
|
X United States Steel | $46.29
-0.2% | Sale (Full)
$1,001 - $15,000 | 7/23/2021 | 5/6/2021 | +78.3%
|
X United States Steel | $46.29
-0.2% | Sale (Full)
$1,001 - $15,000 | 7/23/2021 | 5/6/2021 | +78.3%
|
X United States Steel | $46.29
-0.2% | Sale (Full)
$1,001 - $15,000 | 7/23/2021 | 5/6/2021 | +78.3%
|
X United States Steel | $46.29
-0.2% | Purchase
$100,001 - $250,000 | 7/23/2021 | 5/6/2021 | +78.3%
|
CALX Calix | $34.64
+1.1% | Sale (Full)
$1,001 - $15,000 | 7/23/2021 | 4/27/2021 | -23.1%
 |
CALX Calix | $34.64
+1.1% | Sale (Full)
$1,001 - $15,000 | 7/23/2021 | 4/27/2021 | -23.1%
|
CALX Calix | $34.64
+1.1% | Sale (Full)
$1,001 - $15,000 | 7/23/2021 | 4/27/2021 | -23.1%
|
QQQ Invesco QQQ Trust | $437.05
+1.0% | Sale (Full)
$1,001 - $15,000 | 7/23/2021 | 4/26/2021 | +27.9%
 |
CSX CSX | $36.89
-0.5% | Purchase
$1,001 - $15,000 | 7/23/2021 | 4/21/2021 | +7.8%
 |
ECOM ChannelAdvisor | $23.09
| Sale (Full)
$1,001 - $15,000 | 7/23/2021 | 4/21/2021 | -6.4%
 |
MSFT Microsoft | $420.55
+1.6% | Purchase
$1,001 - $15,000 | 7/23/2021 | 4/20/2021 | +62.8%
 |
META Meta Platforms | $468.11
-0.4% | Purchase
$1,001 - $15,000 | 7/23/2021 | 4/20/2021 | +54.7%
 |
AA Alcoa | $26.89
-3.0% | Sale (Full)
$50,001 - $100,000 | 7/23/2021 | 4/19/2021 | -25.4%
 |
CLF Cleveland-Cliffs | $19.87
+2.8% | Sale (Full)
$15,001 - $50,000 | 7/23/2021 | 4/19/2021 | +14.3%
 |
ECOM ChannelAdvisor | $23.09
| Sale (Full)
$1,001 - $15,000 | 7/23/2021 | 4/19/2021 | -5.6%
 |
CLF Cleveland-Cliffs | $19.87
+2.8% | Purchase
$50,001 - $100,000 | 7/23/2021 | 4/19/2021 | +14.3%
|
CLF Cleveland-Cliffs | $19.87
+2.8% | Sale (Full)
$15,001 - $50,000 | 7/23/2021 | 4/19/2021 | +14.3%
|
ECOM ChannelAdvisor | $23.09
| Purchase
$15,001 - $50,000 | 7/23/2021 | 4/16/2021 | -6.6%
 |
ECOM ChannelAdvisor | $23.09
| Sale (Full)
$1,001 - $15,000 | 7/23/2021 | 4/16/2021 | -6.6%
|
ADBE Adobe | $627.21
+1.8% | Sale (Full)
$1,001 - $15,000 | 7/23/2021 | 4/14/2021 | +22.8%
 |
FCX Freeport-McMoRan | $37.36
-2.0% | Sale (Full)
$15,001 - $50,000 | 7/23/2021 | 4/14/2021 | +2.9%
 |
SSYS Stratasys | $12.97
-3.2% | Sale (Full)
$1,001 - $15,000 | 7/23/2021 | 4/12/2021 | -43.0%
 |
CALX Calix | $34.64
+1.1% | Sale (Full)
$1,001 - $15,000 | 7/23/2021 | 4/8/2021 | -14.4%
 |
CALX Calix | $34.64
+1.1% | Sale (Full)
$1,001 - $15,000 | 7/23/2021 | 4/7/2021 | -11.5%
 |
OXY Occidental Petroleum | $57.47
-1.0% | Sale (Full)
$1,001 - $15,000 | 7/23/2021 | 4/7/2021 | +127.2%
 |
OXY Occidental Petroleum | $57.47
-1.0% | Sale (Full)
$1,001 - $15,000 | 7/23/2021 | 4/7/2021 | +127.2%
|
OXY Occidental Petroleum | $57.47
-1.0% | Purchase
$50,001 - $100,000 | 7/23/2021 | 4/7/2021 | +127.2%
|
OXY Occidental Petroleum | $57.47
-1.0% | Sale (Full)
$1,001 - $15,000 | 7/23/2021 | 4/7/2021 | +127.2%
|
EA Electronic Arts | $140.61
+1.3% | Purchase
$1,001 - $15,000 | 7/23/2021 | 4/5/2021 | -0.7%
 |
INTC Intel | $43.31
+1.9% | Purchase
$1,001 - $15,000 | 7/23/2021 | 4/5/2021 | -34.9%
 |
INTC Intel | $43.31
+1.9% | Sale (Full)
$1,001 - $15,000 | 7/23/2021 | 4/5/2021 | -34.9%
|
PYPL PayPal | $58.91
+5.0% | Sale (Full)
$1,001 - $15,000 | 7/23/2021 | 4/1/2021 | -76.2%
 |
PYPL PayPal | $58.91
+5.0% | Sale (Full)
$1,001 - $15,000 | 7/23/2021 | 4/1/2021 | -76.2%
|
EBAY eBay | $42.43
+1.0% | Sale (Full)
$1,001 - $15,000 | 7/23/2021 | 3/29/2021 | -29.1%
 |
WAL Western Alliance Bancorporation | $61.57
+4.5% | Purchase
$1,001 - $15,000 | 7/23/2021 | 3/29/2021 | -34.2%
 |
WST West Pharmaceutical Services | $409.64
-0.3% | Purchase
$1,001 - $15,000 | 7/23/2021 | 3/29/2021 | +46.0%
 |
WAT Waters | $322.82
-1.2% | Purchase
$1,001 - $15,000 | 7/23/2021 | 3/29/2021 | +13.7%
 |
VMW VMware | $143.00
+0.4% | Purchase
$1,001 - $15,000 | 7/23/2021 | 3/29/2021 | -7.5%
 |
HSY Hershey | $195.45
-3.4% | Purchase
$1,001 - $15,000 | 7/23/2021 | 3/29/2021 | +21.3%
 |
CLX Clorox | $153.20
-0.7% | Purchase
$1,001 - $15,000 | 7/23/2021 | 3/29/2021 | -21.5%
 |
TER Teradyne | $102.31
+3.9% | Purchase
$1,001 - $15,000 | 7/23/2021 | 3/29/2021 | -10.2%
 |
SNA Snap-on | $262.43
-1.4% | Purchase
$1,001 - $15,000 | 7/23/2021 | 3/29/2021 | +15.2%
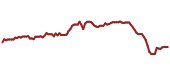 |
NTES NetEase | $106.62
+1.8% | Sale (Full)
$1,001 - $15,000 | 7/23/2021 | 3/29/2021 | +3.4%
 |
IDXX IDEXX Laboratories | $572.21
-0.2% | Purchase
$1,001 - $15,000 | 7/23/2021 | 3/29/2021 | +19.4%
 |
SWKS Skyworks Solutions | $105.05
+0.4% | Purchase
$1,001 - $15,000 | 7/23/2021 | 3/29/2021 | -41.4%
 |
SEIC SEI Investments | $66.65
+0.5% | Purchase
$1,001 - $15,000 | 7/23/2021 | 3/29/2021 | +8.1%
 |
ROK Rockwell Automation | $283.50
+1.7% | Purchase
$1,001 - $15,000 | 7/23/2021 | 3/29/2021 | +4.9%
 |
REGN Regeneron Pharmaceuticals | $953.42
+0.7% | Purchase
$1,001 - $15,000 | 7/23/2021 | 3/29/2021 | +98.0%
 |
DGX Quest Diagnostics | $126.74
+0.2% | Purchase
$1,001 - $15,000 | 7/23/2021 | 3/29/2021 | -1.0%
 |
QCOM QUALCOMM | $151.00
+1.9% | Purchase
$1,001 - $15,000 | 7/23/2021 | 3/29/2021 | +15.0%
 |
PYPL PayPal | $58.91
+5.0% | Purchase
$1,001 - $15,000 | 7/23/2021 | 3/29/2021 | -75.0%
 |
ODFL Old Dominion Freight Line | $435.33
+0.0% | Purchase
$1,001 - $15,000 | 7/23/2021 | 3/29/2021 | +85.0%
 |
NDSN Nordson | $263.63
+0.7% | Sale (Full)
$1,001 - $15,000 | 7/23/2021 | 3/29/2021 | +29.9%
 |
INTU Intuit | $658.16
+0.8% | Sale (Full)
$1,001 - $15,000 | 7/23/2021 | 3/29/2021 | +75.7%
 |
JNJ Johnson & Johnson | $156.76
+0.2% | Sale (Full)
$1,001 - $15,000 | 7/23/2021 | 3/29/2021 | -5.6%
 |
FTNT Fortinet | $70.44
+3.8% | Sale (Full)
$1,001 - $15,000 | 7/23/2021 | 3/29/2021 | +91.8%
 |
EW Edwards Lifesciences | $85.01
-0.9% | Purchase
$1,001 - $15,000 | 7/23/2021 | 3/29/2021 | +3.1%
 |
BHP BHP Group | $60.18
+0.2% | Purchase
$1,001 - $15,000 | 7/23/2021 | 3/29/2021 | -13.8%
 |
BIO Bio-Rad Laboratories | $325.22
-0.3% | Purchase
$1,001 - $15,000 | 7/23/2021 | 3/29/2021 | -42.9%
 |
CE Celanese | $148.92
+0.0% | Purchase
$1,001 - $15,000 | 7/23/2021 | 3/29/2021 | -2.2%
 |
CHE Chemed | $589.00
-0.6% | Purchase
$1,001 - $15,000 | 7/23/2021 | 3/29/2021 | +24.4%
 |
GNTX Gentex | $35.32
+1.2% | Purchase
$1,001 - $15,000 | 7/23/2021 | 3/29/2021 | -0.1%
 |
GGG Graco | $88.16
+0.4% | Purchase
$1,001 - $15,000 | 7/23/2021 | 3/29/2021 | +22.0%
 |
HON Honeywell International | $194.84
+0.7% | Sale (Full)
$1,001 - $15,000 | 7/23/2021 | 3/29/2021 | -11.0%
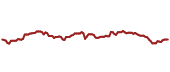 |
DECK Deckers Outdoor | $845.22
+1.5% | Purchase
$1,001 - $15,000 | 7/23/2021 | 3/29/2021 | +163.9%
 |
CNR Cornerstone Building Brands | $24.66
| Purchase
$1,001 - $15,000 | 7/23/2021 | 3/29/2021 | +89.7%
 |
CL Colgate-Palmolive | $83.46
-0.9% | Sale (Full)
$1,001 - $15,000 | 7/23/2021 | 3/29/2021 | +4.5%
 |
ATHM Autohome | $25.63
+1.0% | Purchase
$1,001 - $15,000 | 7/23/2021 | 3/29/2021 | -73.1%
 |
GOOGL Alphabet | $149.00
+2.1% | Purchase
$1,001 - $15,000 | 7/23/2021 | 3/29/2021 | +45.7%
 |
ALGN Align Technology | $296.37
+0.5% | Purchase
$1,001 - $15,000 | 7/23/2021 | 3/29/2021 | -42.6%
 |
AME AMETEK | $168.50
+1.3% | Purchase
$1,001 - $15,000 | 7/23/2021 | 3/29/2021 | +31.4%
 |
MMM 3M | $92.90
-0.3% | Purchase
$1,001 - $15,000 | 7/23/2021 | 3/29/2021 | -52.5%
 |
IEX IDEX | $228.20
+1.0% | Purchase
$1,001 - $15,000 | 7/23/2021 | 3/29/2021 | +9.6%
 |
MRK Merck & Co., Inc. | $125.45
-0.9% | Sale (Full)
$1,001 - $15,000 | 7/23/2021 | 3/29/2021 | |
IEX IDEX | $228.20
+1.0% | Purchase
$1,001 - $15,000 | 7/23/2021 | 3/29/2021 | +9.6%
|
EA Electronic Arts | $140.61
+1.3% | Sale (Full)
$1,001 - $15,000 | 7/23/2021 | 3/29/2021 | +4.2%
 |
AA Alcoa | $26.89
-3.0% | Sale (Full)
$15,001 - $50,000 | 7/23/2021 | 3/16/2021 | -8.9%
 |
AA Alcoa | $26.89
-3.0% | Purchase
$1,001 - $15,000 | 7/23/2021 | 3/16/2021 | -8.9%
|
AA Alcoa | $26.89
-3.0% | Purchase
$100,001 - $250,000 | 7/23/2021 | 3/16/2021 | -8.9%
|
AA Alcoa | $26.89
-3.0% | Sale (Full)
$15,001 - $50,000 | 7/23/2021 | 3/16/2021 | -8.9%
|
CLF Cleveland-Cliffs | $19.87
+2.8% | Sale (Full)
$1,001 - $15,000 | 7/23/2021 | 3/12/2021 | +13.3%
 |
CLF Cleveland-Cliffs | $19.87
+2.8% | Sale (Full)
$1,001 - $15,000 | 7/23/2021 | 3/12/2021 | +13.3%
|
CLF Cleveland-Cliffs | $19.87
+2.8% | Purchase
$15,001 - $50,000 | 7/23/2021 | 3/12/2021 | +13.3%
|
ADP Automatic Data Processing | $249.99
-0.4% | Sale (Full)
$1,001 - $15,000 | 7/23/2021 | 3/11/2021 | +37.7%
 |
ADBE Adobe | $627.21
+1.8% | Sale (Full)
$1,001 - $15,000 | 7/23/2021 | 2/19/2021 | +30.9%
 |
OXY Occidental Petroleum | $57.47
-1.0% | Sale (Full)
$1,001 - $15,000 | 7/23/2021 | 2/16/2021 | +117.2%
 |
OXY Occidental Petroleum | $57.47
-1.0% | Sale (Full)
$1,001 - $15,000 | 7/23/2021 | 2/16/2021 | +117.2%
|
OXY Occidental Petroleum | $57.47
-1.0% | Purchase
$15,001 - $50,000 | 7/23/2021 | 2/16/2021 | +117.2%
|
OXY Occidental Petroleum | $57.47
-1.0% | Sale (Full)
$1,001 - $15,000 | 7/23/2021 | 2/16/2021 | +117.2%
|
OXY Occidental Petroleum | $57.47
-1.0% | Sale (Full)
$1,001 - $15,000 | 7/23/2021 | 2/16/2021 | +117.2%
|
OXY Occidental Petroleum | $57.47
-1.0% | Sale (Full)
$1,001 - $15,000 | 7/23/2021 | 2/16/2021 | +117.2%
|
ECOM ChannelAdvisor | $23.09
| Sale (Full)
$1,001 - $15,000 | 7/23/2021 | 2/11/2021 | -18.8%
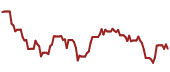 |
ECOM ChannelAdvisor | $23.09
| Sale (Full)
$1,001 - $15,000 | 7/23/2021 | 2/10/2021 | -9.5%
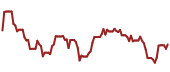 |
ECOM ChannelAdvisor | $23.09
| Purchase
$15,001 - $50,000 | 7/23/2021 | 2/10/2021 | -9.5%
|
ECOM ChannelAdvisor | $23.09
| Purchase
$1,001 - $15,000 | 7/23/2021 | 2/10/2021 | -9.5%
|
ECOM ChannelAdvisor | $23.09
| Sale (Full)
$1,001 - $15,000 | 7/23/2021 | 2/10/2021 | -9.5%
|
ECOM ChannelAdvisor | $23.09
| Sale (Full)
$1,001 - $15,000 | 7/23/2021 | 2/10/2021 | -9.5%
|
ECOM ChannelAdvisor | $23.09
| Sale (Full)
$1,001 - $15,000 | 7/23/2021 | 2/10/2021 | -9.5%
|
ECOM ChannelAdvisor | $23.09
| Sale (Full)
$1,001 - $15,000 | 7/23/2021 | 2/10/2021 | -9.5%
|
ECOM ChannelAdvisor | $23.09
| Purchase
$15,001 - $50,000 | 7/23/2021 | 2/10/2021 | -9.5%
|
VEEV Veeva Systems | $216.76
+0.6% | Purchase
$1,001 - $15,000 | 7/23/2021 | 2/9/2021 | -28.8%
 |
F Ford Motor | $12.68
-1.2% | Sale (Full)
$1,001 - $15,000 | 7/23/2021 | 2/8/2021 | +9.7%
 |
SSYS Stratasys | $12.97
-3.2% | Sale (Full)
$1,001 - $15,000 | 7/23/2021 | 2/4/2021 | -72.7%
 |
SSYS Stratasys | $12.97
-3.2% | Sale (Full)
$1,001 - $15,000 | 7/23/2021 | 2/4/2021 | -72.7%
|
BRK.B Berkshire Hathaway | $398.36
+0.2% | Purchase
$50,001 - $100,000 | 7/23/2021 | 2/3/2021 | +71.5%
 |
MSFT Microsoft | $420.55
+1.6% | Purchase
$1,001 - $15,000 | 7/23/2021 | 2/3/2021 | +73.1%
 |
CSX CSX | $36.89
-0.5% | Sale (Full)
$1,001 - $15,000 | 7/23/2021 | 2/2/2021 | +23.5%
 |
BABA Alibaba Group | $72.02
+1.8% | Sale (Full)
$15,001 - $50,000 | 7/23/2021 | 1/25/2021 | -72.4%
 |
CLF Cleveland-Cliffs | $19.87
+2.8% | Purchase
$15,001 - $50,000 | 7/23/2021 | 1/21/2021 | +21.8%
 |
CLF Cleveland-Cliffs | $19.87
+2.8% | Sale (Full)
$1,001 - $15,000 | 7/23/2021 | 1/21/2021 | +21.8%
|
SDOG ALPS Sector Dividend Dogs ETF | $50.36
-0.2% | Purchase
$15,001 - $50,000 | 7/23/2021 | 1/15/2021 | +8.1%
 |
TDY Teledyne Technologies | $434.03
+0.8% | Sale (Full)
$50,001 - $100,000 | 7/23/2021 | 1/13/2021 | +12.2%
 |
QQQ Invesco QQQ Trust | $437.05
+1.0% | Sale (Full)
$15,001 - $50,000 | 7/23/2021 | 1/13/2021 | +38.3%
 |
AA Alcoa | $26.89
-3.0% | Sale (Full)
$1,001 - $15,000 | 7/23/2021 | 1/6/2021 | +6.7%
 |
AA Alcoa | $26.89
-3.0% | Purchase
$15,001 - $50,000 | 7/23/2021 | 1/6/2021 | +6.7%
|
AA Alcoa | $26.89
-3.0% | Sale (Full)
$1,001 - $15,000 | 7/23/2021 | 1/6/2021 | +6.7%
|
AA Alcoa | $26.89
-3.0% | Purchase
$15,001 - $50,000 | 7/23/2021 | 1/6/2021 | +6.7%
|
AA Alcoa | $26.89
-3.0% | Sale (Full)
$1,001 - $15,000 | 7/23/2021 | 1/6/2021 | +6.7%
|
META Meta Platforms | $468.11
-0.4% | Sale (Full)
$1,001 - $15,000 | 7/23/2021 | 1/5/2021 | +72.8%
 |
INTC Intel | $43.31
+1.9% | Sale (Full)
$1,001 - $15,000 | 7/23/2021 | 1/4/2021 | -12.8%
 |
WY Weyerhaeuser | $33.28
+0.8% | Sale (Full)
$50,001 - $100,000 | 7/23/2021 | 1/4/2021 | +1.4%
 |
INTC Intel | $43.31
+1.9% | Sale (Full)
$1,001 - $15,000 | 7/23/2021 | 1/4/2021 | -12.8%
|
INTC Intel | $43.31
+1.9% | Sale (Full)
$1,001 - $15,000 | 7/23/2021 | 1/4/2021 | -12.8%
|
INTC Intel | $43.31
+1.9% | Sale (Full)
$1,001 - $15,000 | 7/23/2021 | 1/4/2021 | -12.8%
|
ONEQ Fidelity NASDAQ Composite Index ETF | $63.03
+1.2% | Sale (Full)
$100,001 - $250,000 | 7/23/2021 | 1/4/2021 | -87.2%
 |
DG Dollar General | $135.21
-0.3% | Sale (Full)
$50,001 - $100,000 | 7/23/2021 | 1/4/2021 | -35.5%
 |